The work done contributes to task 3 and task 4.2 of the Technical Annex
The periodic Forest Inventory in Germany (Forest Master Plan) provides
foresters and landscape architects with useful forest stand data for the
assessment of forest aesthetics. All stands in Bavaria are described regarding
their species mixture, tree age, applicated silvicultural methods, indexed
tree density and inherent forest functions (in Baden-Württemberg additionally:
basal area, number of trees per ha, mean tree diameter and height, volume
per ha in qbm etc).
The appearance of forest interiors and forest from the distance primarily
depends on parameters like tree mixture and tree density, i.e. consequently
on the silvicultural management. Hence any quantitative aesthetical evaluation
has to be based on these measurable parameters. The question for a reasonable
weighting of every parameter, i.e. its aesthetic effect on public landscape
perception, cannot be answered before the approvement of this issue by
a public preferency survey.
The following evaluation method uses forest type and forest structure for
the aesthetic assessment, where forest type is composed of the parameters
tree age, tree mixture and silvicultural management form. The forest structure
results from certain stand characteristics (ski lanes, open sites etc)
and structural features caused by some silvicultural treatment forms (seed
trees, kernels, etc).
The aesthetical weighting of the parameters was done professionally, ie
it is based on common research findings and the on the experience of experts.
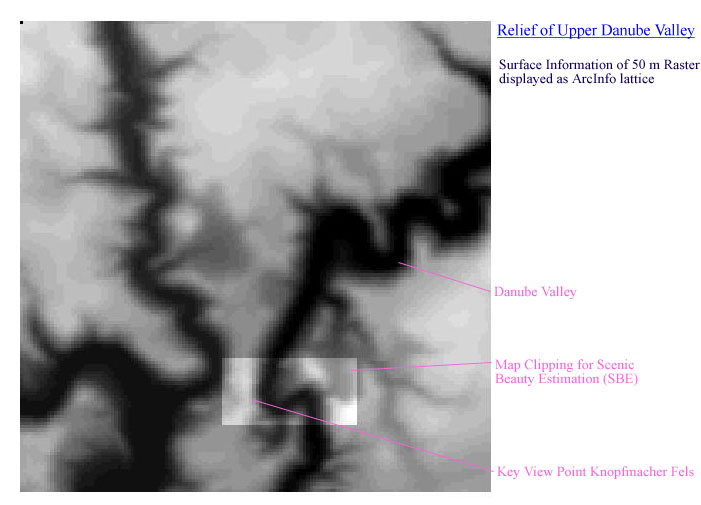
By means of a prelimnary Scenic Beauty Estimation
Matrix (SBE Matrix, see map15txt.jpg) the evaluated parameters are
prepared for further digital processing. The open and flexible matrix form
allows to implement later results of the Public
Preferency Survey easily into this technical procedure as well as further
parameters.
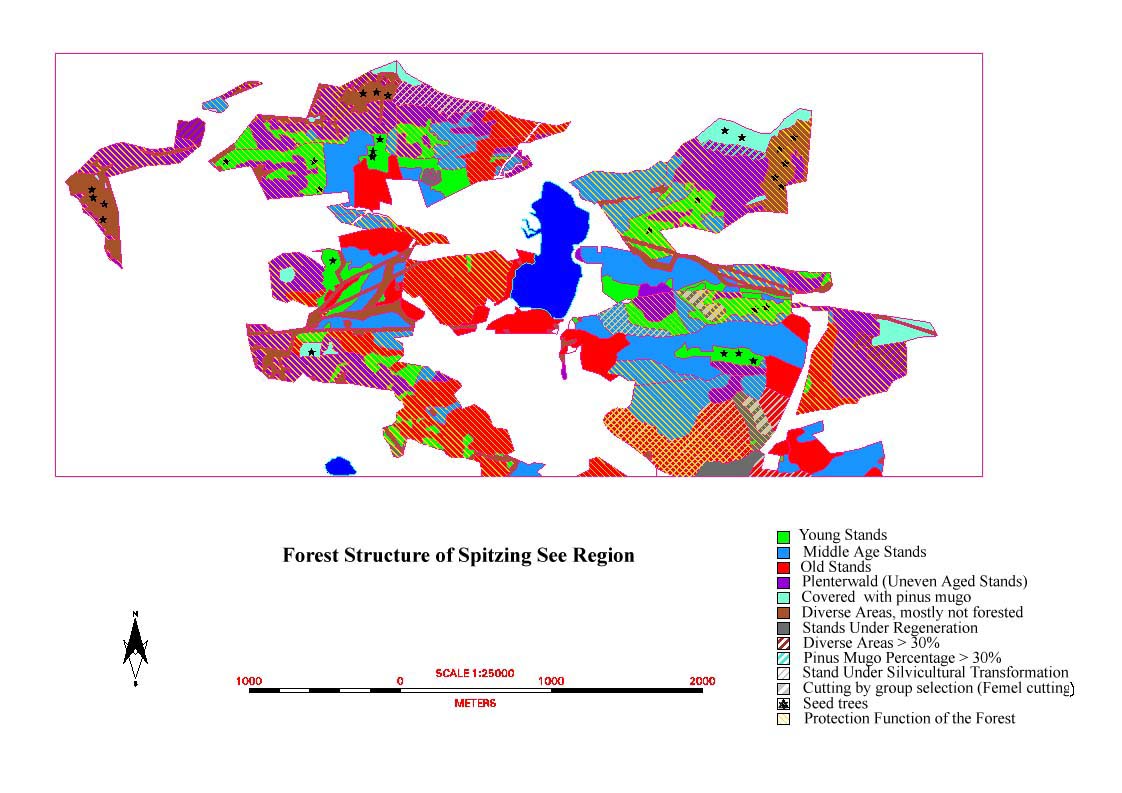
The Forest Master Plan of the Forestry District of Schliersee (1:10.000)
was scanned with 150 dpi and saved in TIFF (*.tif) format. The three image
files were georeferenced in ArcInfo (command: register), with
an RMS (Root Mean Square) error of 2.5m, orientated (command: rectify)
and compiled to one image catalog (command: createcatalog). The
forest stands were digitized onscreen with ArcInfo and refined to the Forest
Structure Map (see map14.jpg). All stands were labeled with their unique
stand number. The stand parameters from the master plan (forest types,
forest structure, forest function, stand number) were compiled in an attribute
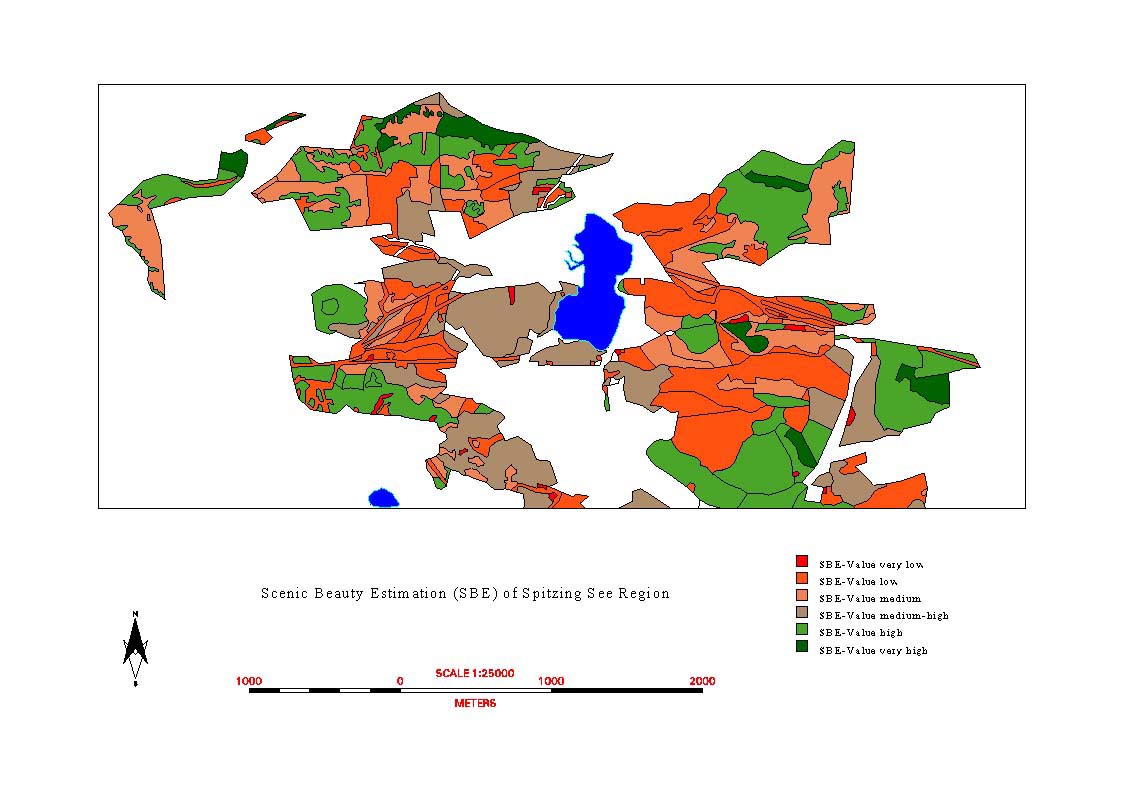
table called wald.lut. With a simple ArcInfo aml file
(sbeaml.txt) the SBE (Scenic Beauty Estimation) value was calculated for
every stand. Alternatively an aml file with logical operands (if, and,
equal, then) is good to order all stands due to their aesthetical structures
and to compute the SBE values.
The calculated attribute table (waldlut.txt)
was joined to the map (the stand number was used as the join item).
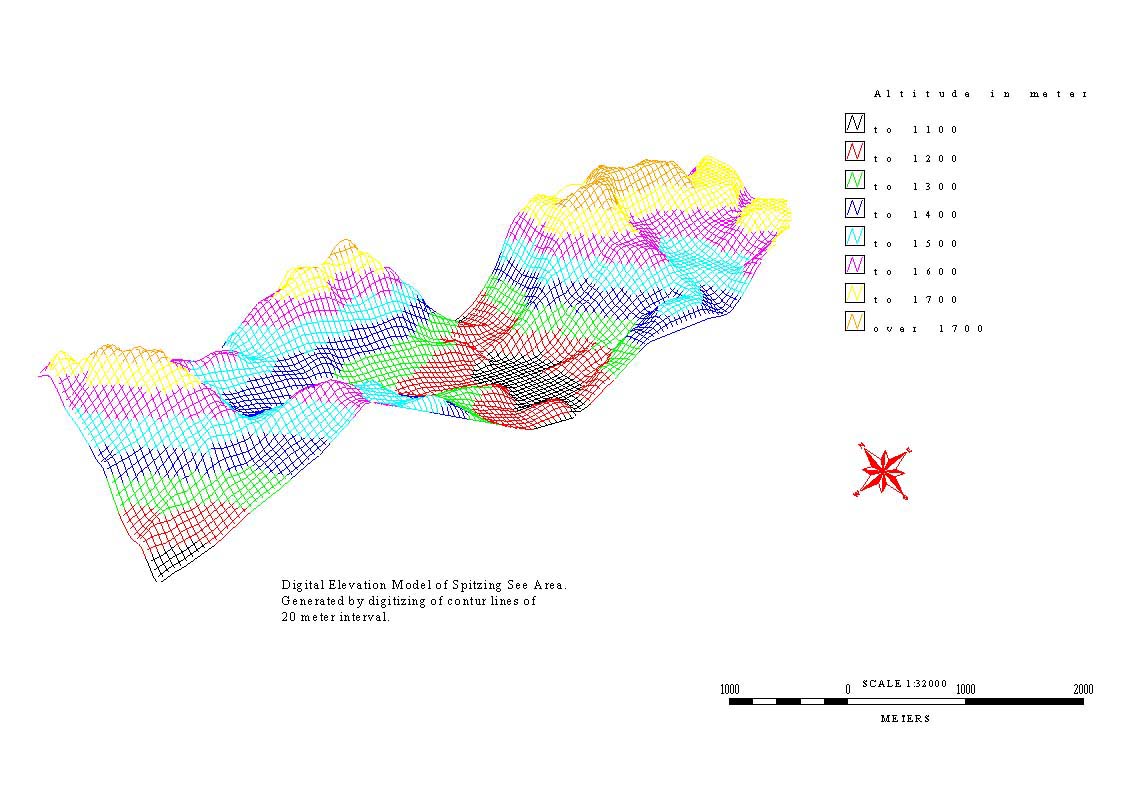
Finally the SBE value was used to colour the SBE-Map
of the Spitzingsee area (map15.jpg).
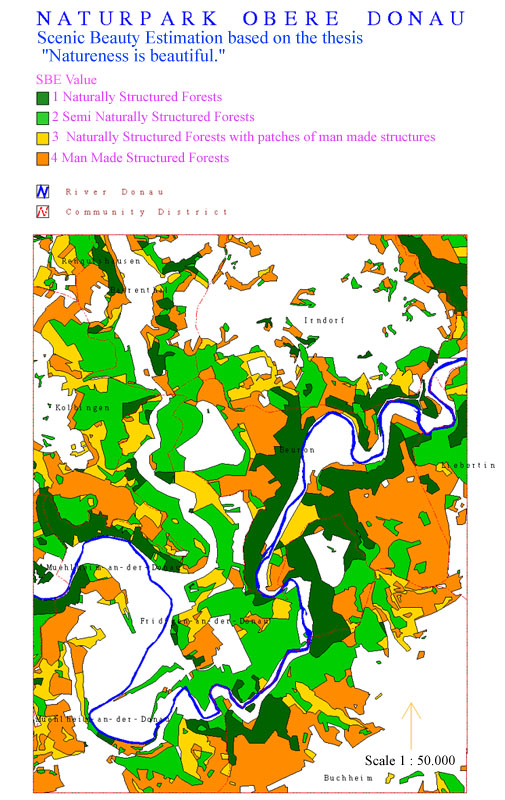
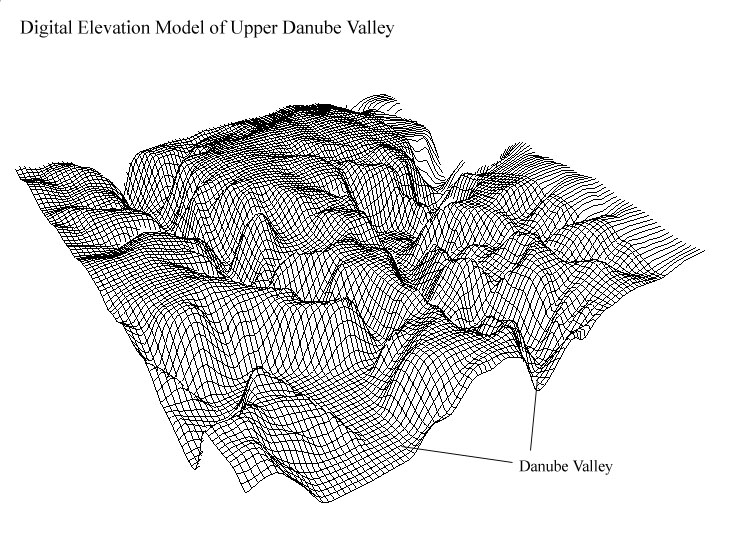
In contrast to the shown evaluation method the example of the SBE
Model of the Upper Danube Valley (beusbe.jpg) demonstrates an ecological
approach to aesthetical landscape assessment.
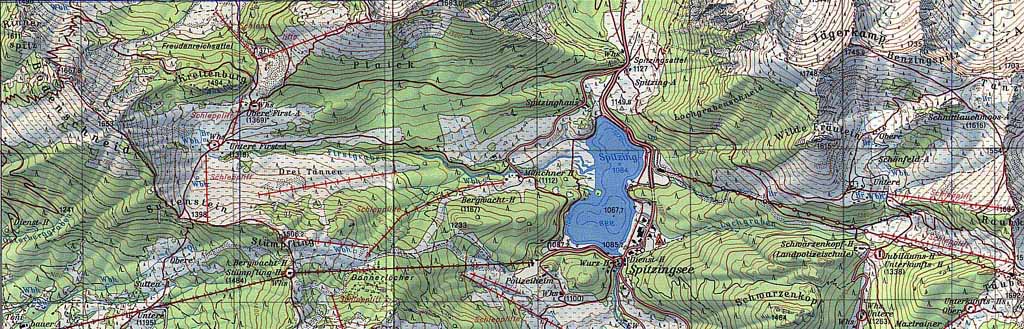
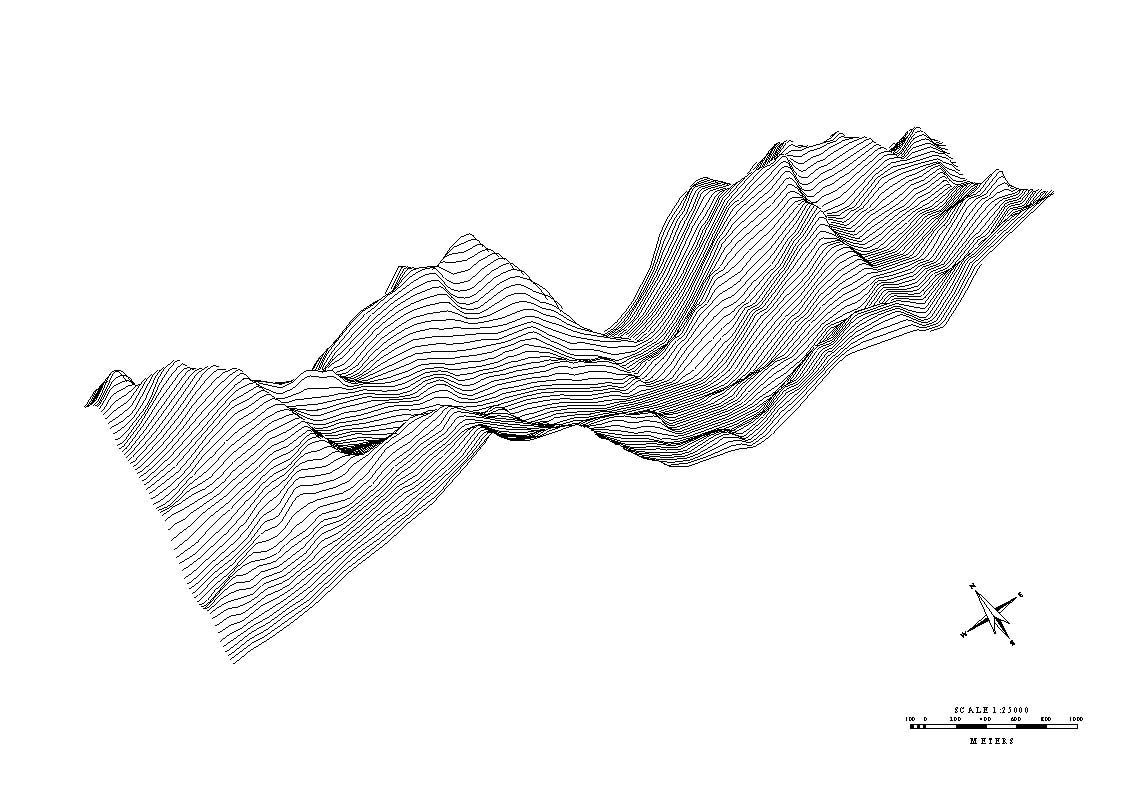
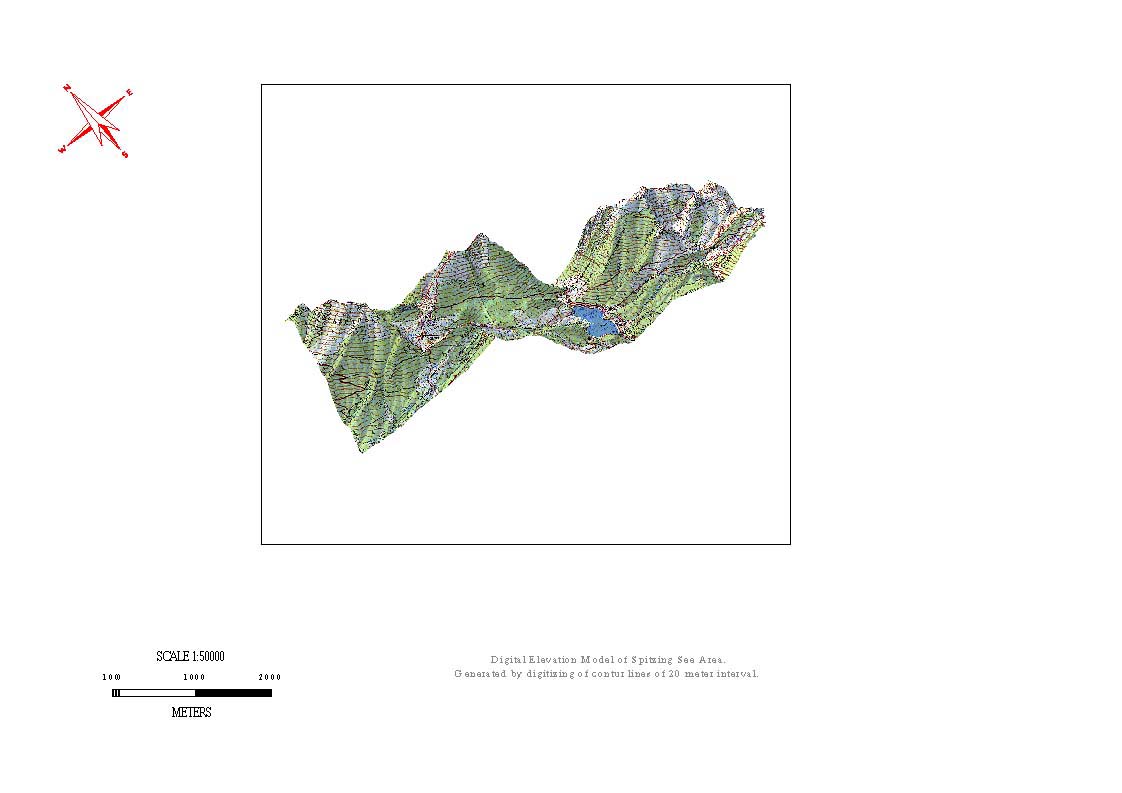
The Topopgraphical Map 1:25.000 (map03.jpg) was scanned and georeferenced for digitizing the 20 m contour lines and geodesic points of altitude. A tin was generated with the arctin command in ArcInfo. Alternatively different snap options (optimum at a weed tolerance of 20 m) and the createtin command, which reads either points or arcs, were tested. The tin can be displayed in arcplot in different modes, aspects and surfaceshades, e.g. as:
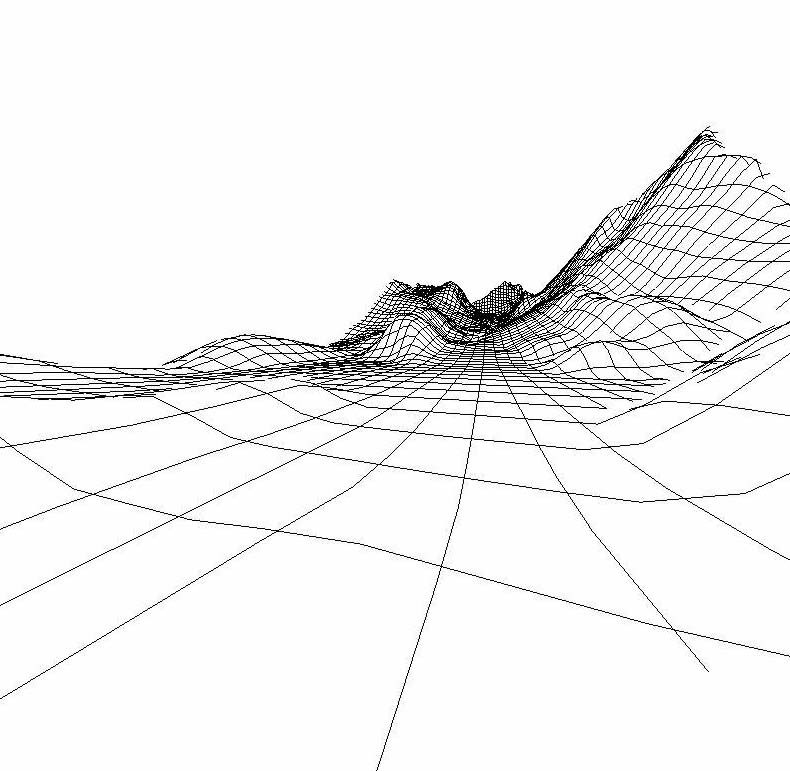
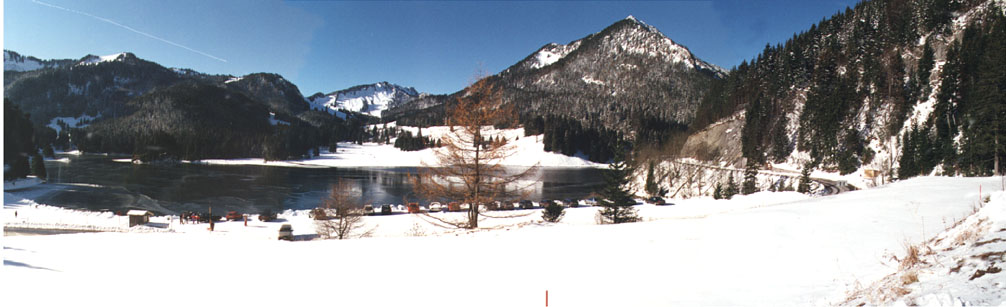
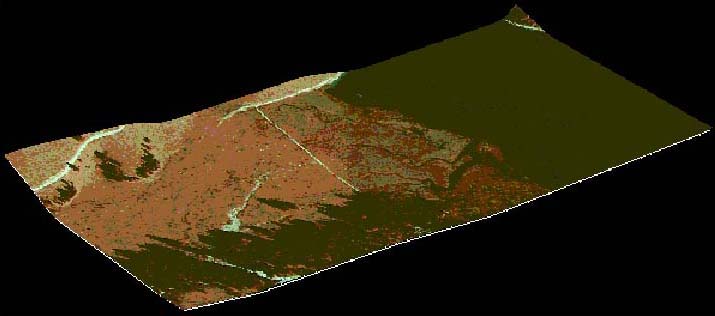
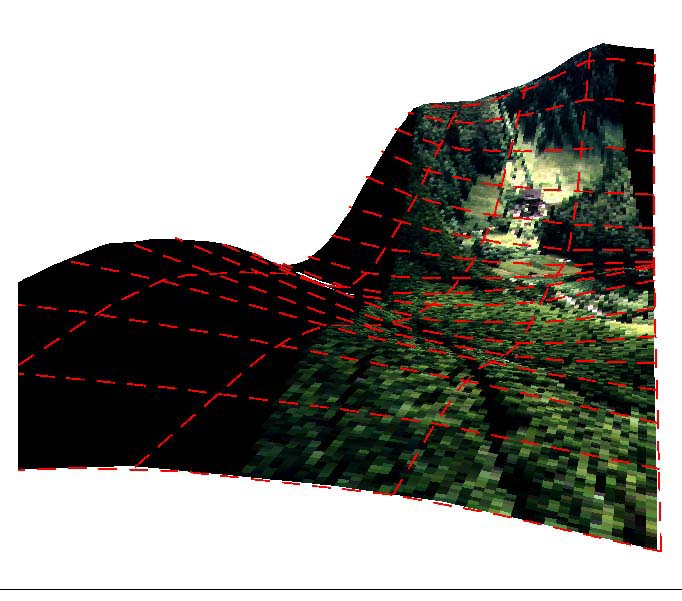
By means of the observerposition command different views from
different key view points can be displayed on the screen, like the fishnet
view over the lake (map05.jpg) to the west, which corresponds to the
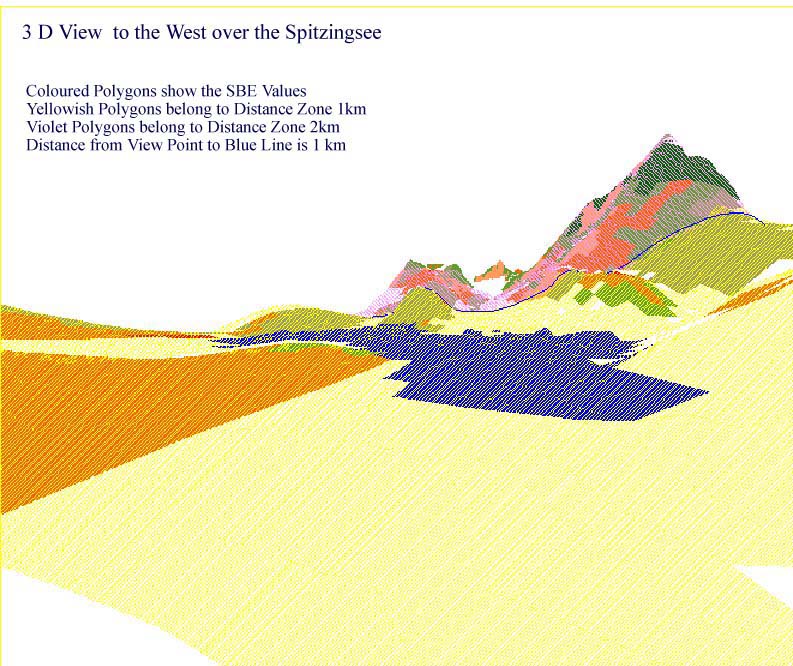
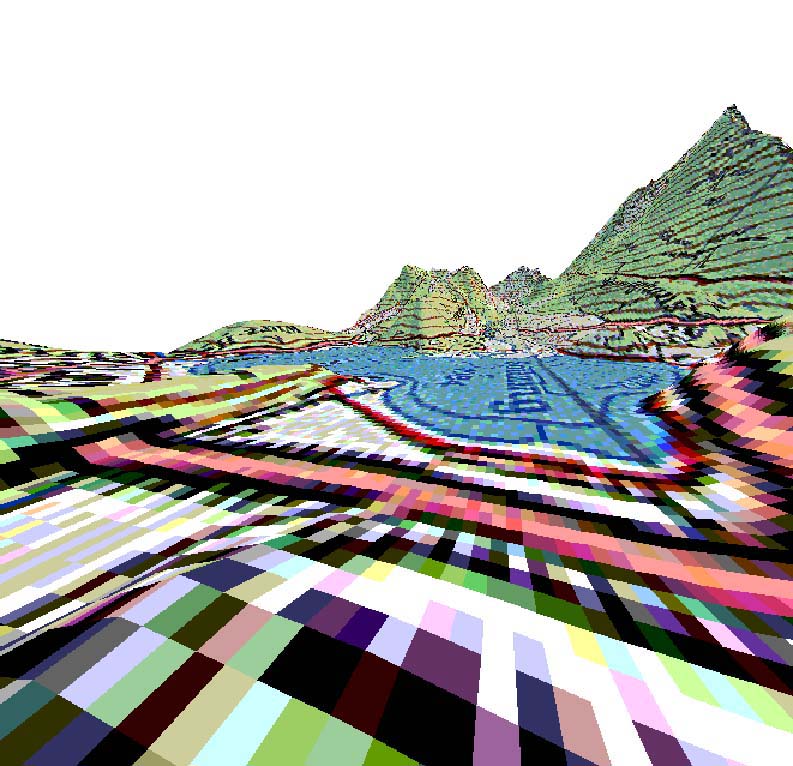
photorealistic view. The combination of this view
with the SBE-Map (map15.jpg) and with polygons,
which mark view distance zones (viewdz.doc) provides
3-dimensional information (map16.jpg, see also
map06.jpg) for the visibility analysis of the area.
In some cases the surface information from topographical maps and digital surface models of the survey department describe the land surface of the earth and not the vegetation surface. Especially for visibility analysis in a detailed scale this fact may severly influence the quality of the results. To equalize surface models to the desired level and to refine the surface model locally a process routine with Arc/GRID (description in German, howdone.txt) is necessary. In our case the docell command was used to adapt the land surface to the vegetation surface, i.e. to the forest canopy. First of all the tin must be converted to a grid, i.e. a lattice using the tinlattice command (use gridascii and asciigrid to eliminate problems). The forest coverage has to be gridded with the forest type item, which corresponds to the height (command: polygrid). Finally the docell aml computes the new surface lattice.
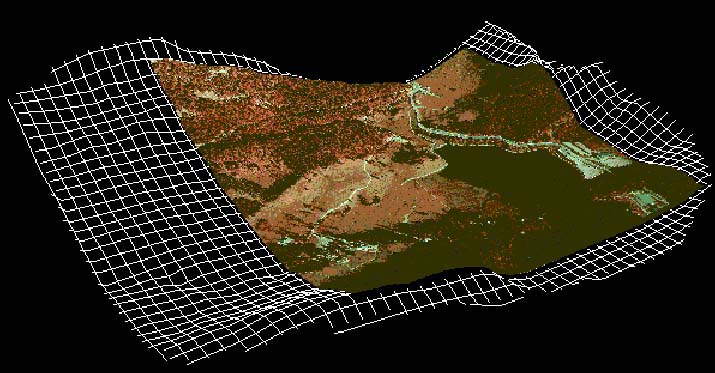
To do landscape aesthetical analysis that gives a photorealistic impression and also enables the scientist to proof the model visually and overlay of photos and other scanned images is worthful. A comparison between the "raw" digital elevation model (map01.jpg) of the Spitzingsee area and the "enriched" version (map04.jpg) demonstrates how the combination of different data improves the information received. The most important step for image overlay is the correct measurement of reference points (passpt.txt) in the field by a Global Positioning System (GPS) or from a topographical map. The accuracy of the reference points determines the accuracy of the map overlay. The RMS error is an indicator for the accuracy of georefernced images, the smaller the better. The images also have to be rectified before you can start the surfacedrape procedure. Here are examples of
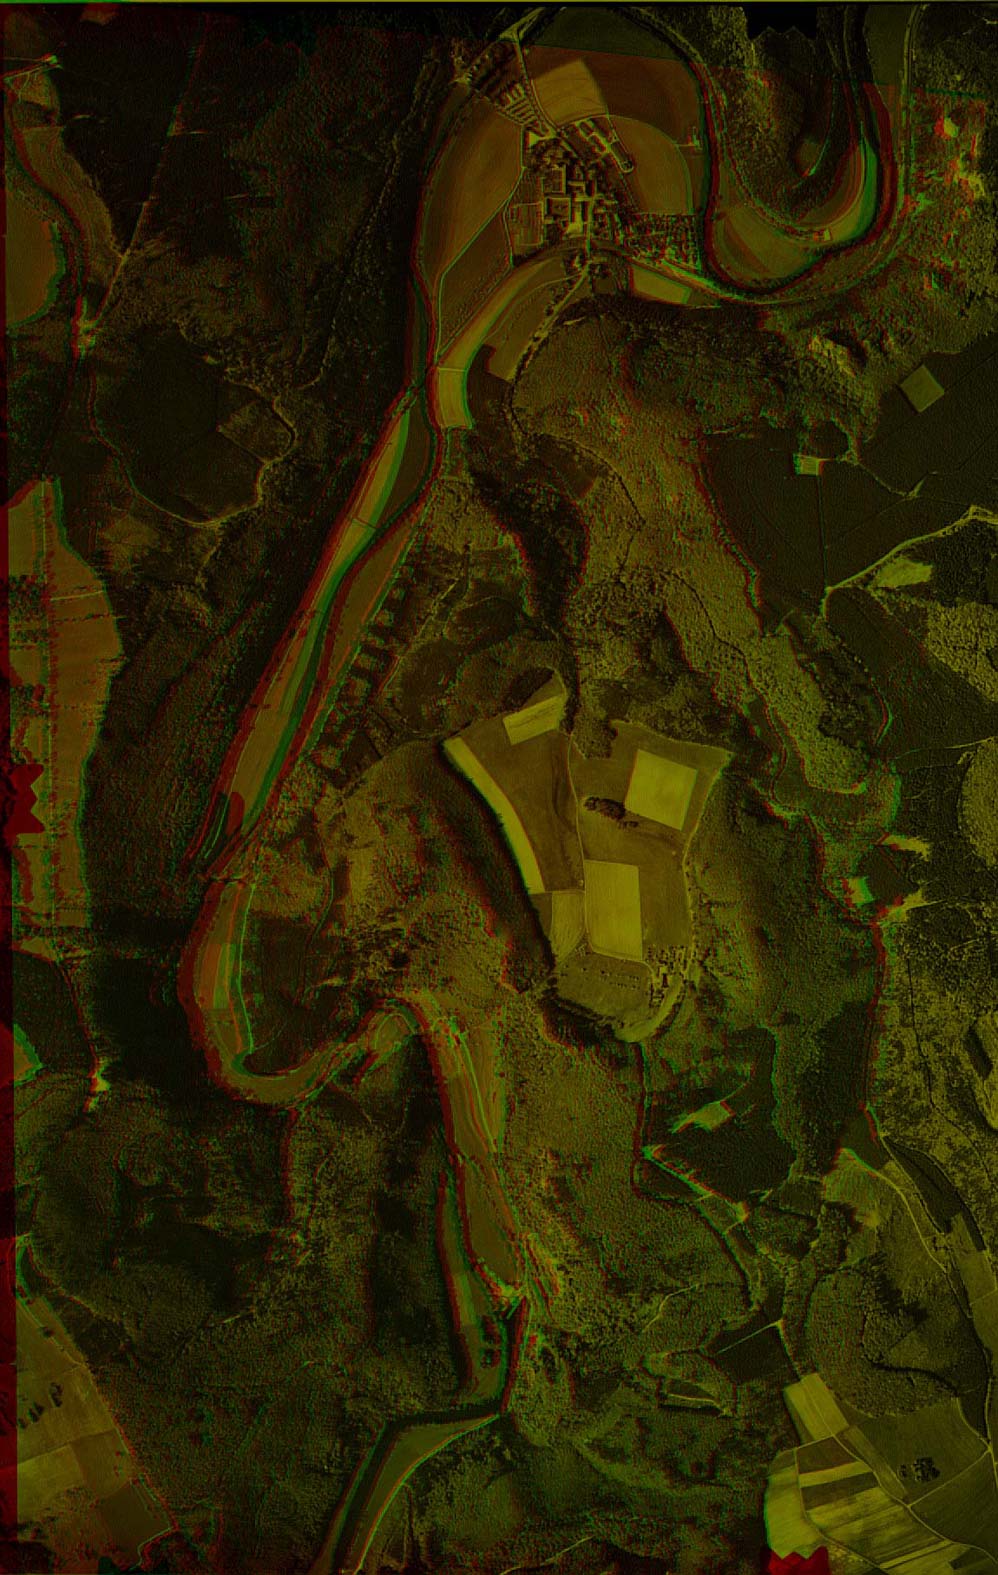
The creation of an anaglyph image of the Upper Danube
Valley (map11.jpg) was realised in EASI/PACE from PCI by eliminating
the blue/red respectively the blue/green channel of a pair of overlapping
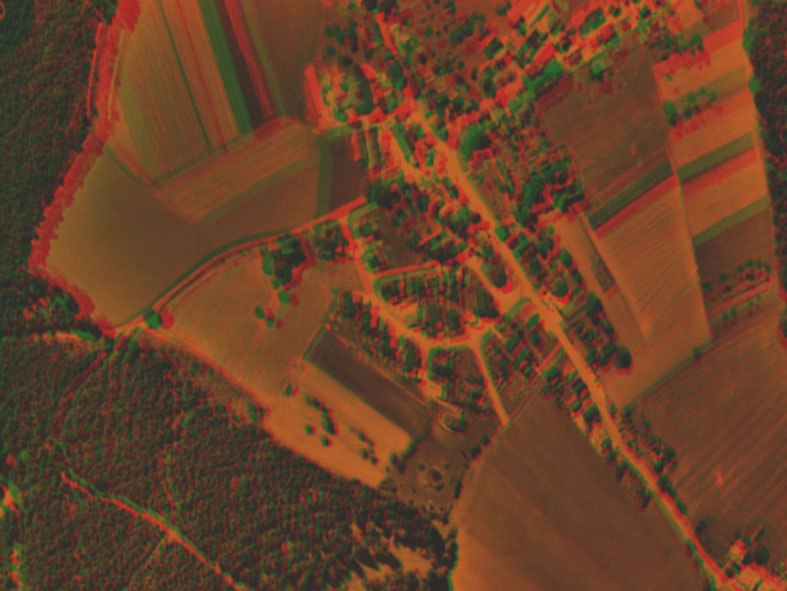
aerial photos. The same method was used in Photoshop
(map13.jpg) for a test site in the Black Forest with poorer results. Microstation,
CAD from Intergraph, also provides a stereo rendering option for CAD files
that delivers very good results. Using a red/green 3D glasses gives a 3-dimensional
impression of the landscape. Overlaying anaglyphs with other ArcInfo coverages
in ArcView facilitates 3-dimensional planning.
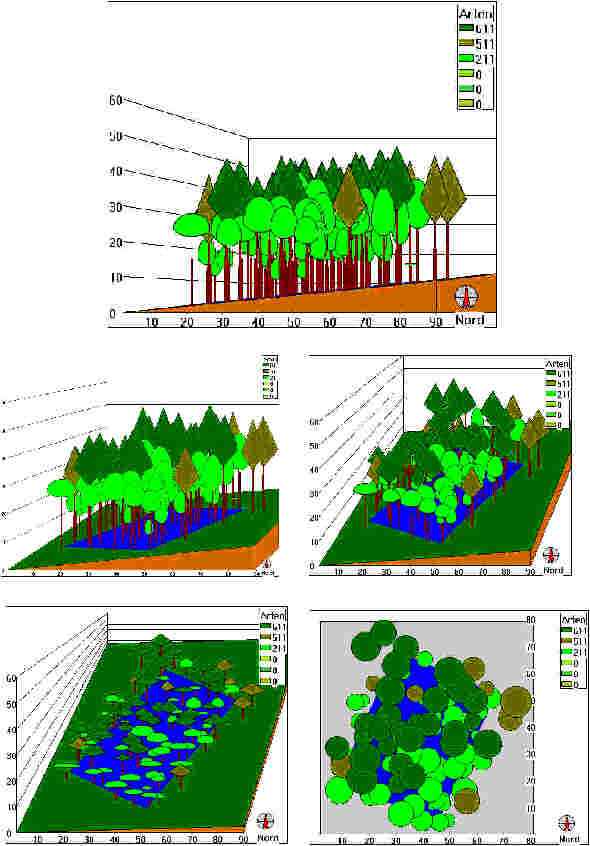
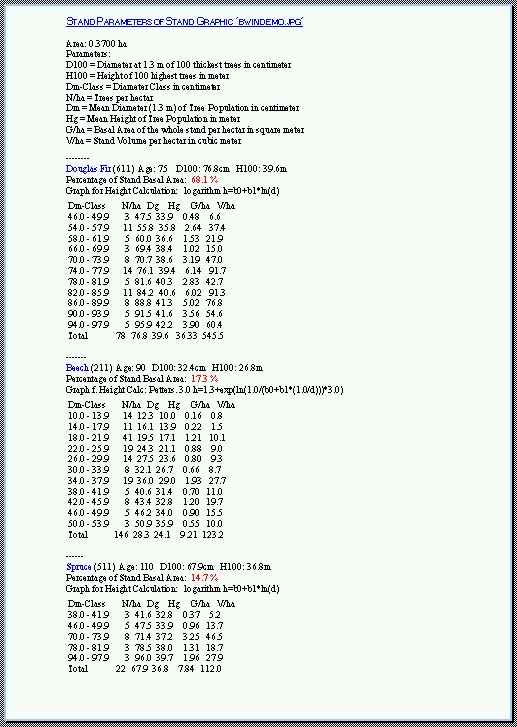
The performance of the BWIN software is the graphical
visualisation (bwindemo.jpg) of stand parameters (bwintxt.jpg,
bwintxt.doc), a new version with an improved
graphic module has been released and will soon be tested.