FORAM
Seminar: A Project for the European Forest
Departamento de Ambiente e Ordenamento
Universidade de Aveiro
3800 Aveiro, Portugal
Thursday, 29th January 1998
Markus Weidenbach
Institute for Landscape
Planning and Nature Conservation
Ludwig-Maximilians University
of Munich
www.lnn.forst.uni-muenchen.de/daten/foram
The
Role of Computer Technology in the FORAM Project
How has computer technology
and the use of digital data contributed to the FORAM project and its
objectives?
The 3 components of the used computer technology
are:
A.
The Internet
-
e-mail for communication (MIME compatible,
in future: video conferences)
-
ftp (file transfer protocol) to transfer files
via the German ftp server (password protected).The ftp is implemented in
the latest WWW browser and enables foreign project partner to use the ftp
server as a common harddisk.
-
the ftp server in Germany
-
WWW (world wide web) is based on the ftp and
enables the project partners to publish their data in html (hyper text
markup language) in an independent format world wide. The browser software
like netscape combines e-mail, ftp and html and facilitates the communication
via Internet. Examples from the German FORAM home page show how information
can be distributed - world wide or with restricted access.
The Scottish team used the WWW for an international
survey on public attitudes towards forested landscapes. Knowing the public
attitude is important for landscape design and the short history of landscape
planning has shown that a good communication between landscape architects
and citizens is essential for the acceptance of design proposals. We therefore
regard the WWW as an adequate tool to improve the co-operation between
landscape architects and citizens in the future.
B.
Geographic Information System (GIS)
GIS is the most important component of the
computer technology in the project. It has been used by all partners to
analyse their study areas and to present their findings. All partners used
ArcInfo, the Portuguese team additionally researched the capabilities
of Microstation, the Spanish team MacGIS, the Greek team
GRASS and the German team ArcView. Since almost all analysis
in the project have been done with ArcInfo we want to outline some
principles of our GIS work on the example of ArcInfo.
We chiefly used 3 components
of the GIS package:
-
the vector GIS (low file
size, allows neighbourhood calculations, topological structure, high processing
speed)
-
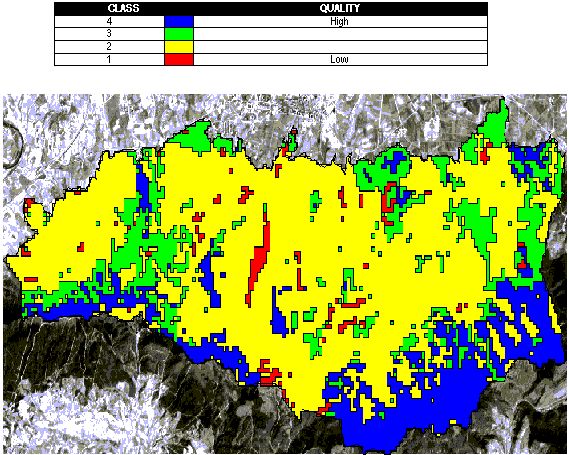
the raster GIS (ArcGrid,
"pixel wise" information and calculations, frequent basis for 2.5 dimensional
calculations, digital elevation models)
-
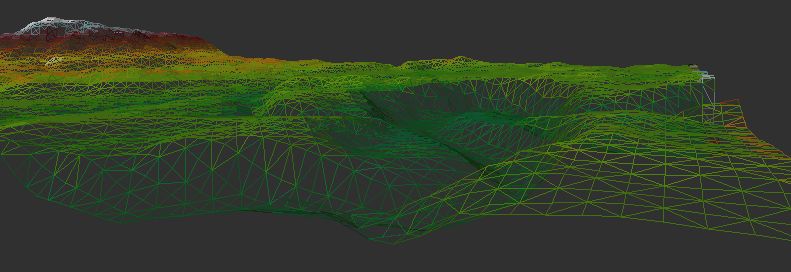
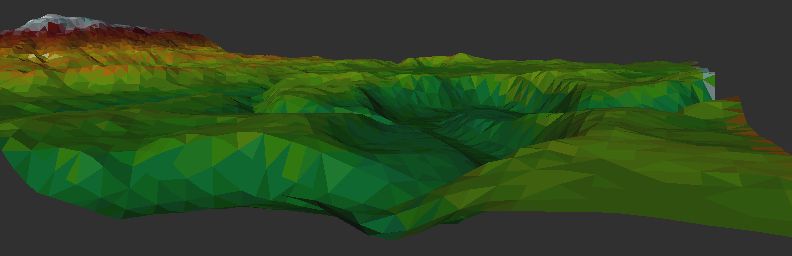
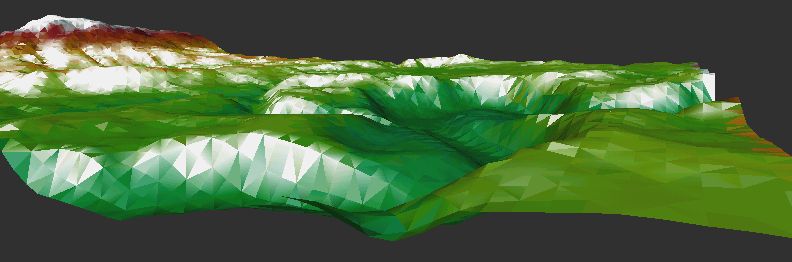
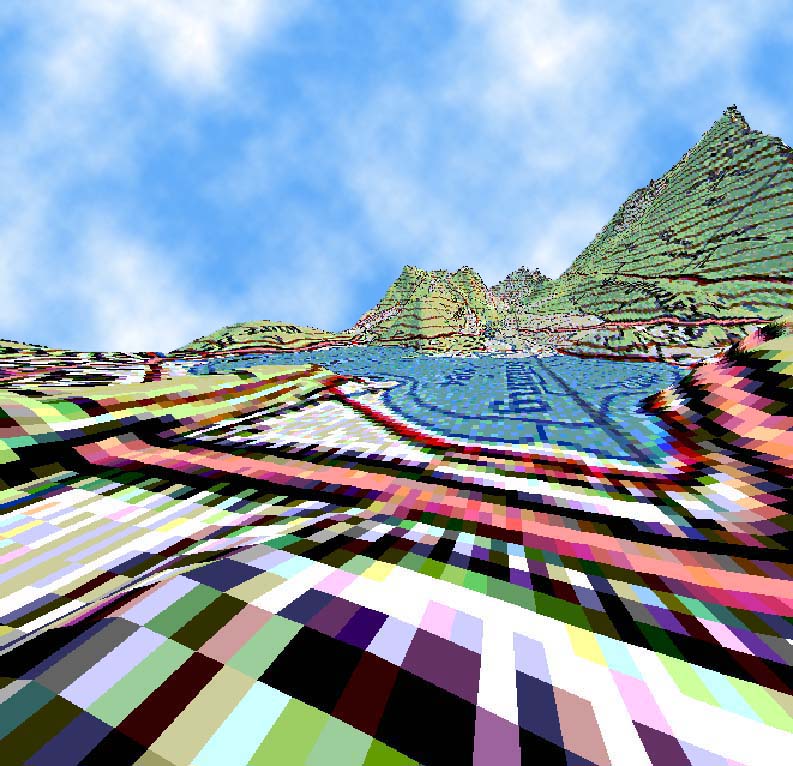
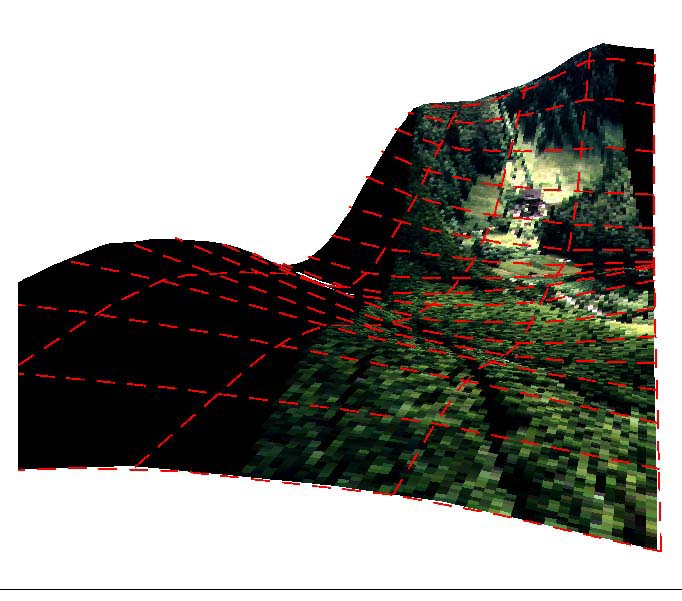
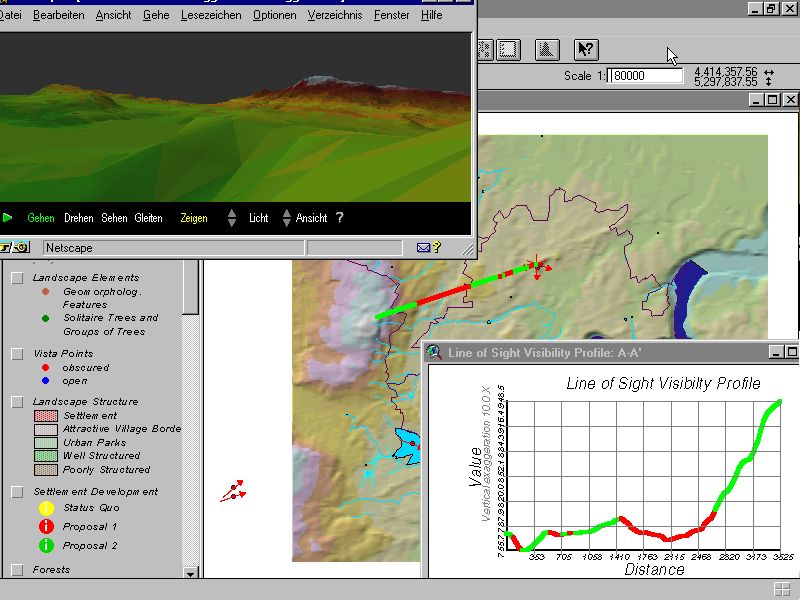
the TIN module
(Triangulated Irregular Network, 3 dimensional processing, calculation
and display of views from vista points, realistic display of views when
images are draped over the TIN, basis for virtual reality models)
.
The GIS work can be divided
into three tasks:
-
the one-dimensional analysis is the management
of spatial information in tables (tables are the core of the relational
database, the "background" of the GIS grafics)
-
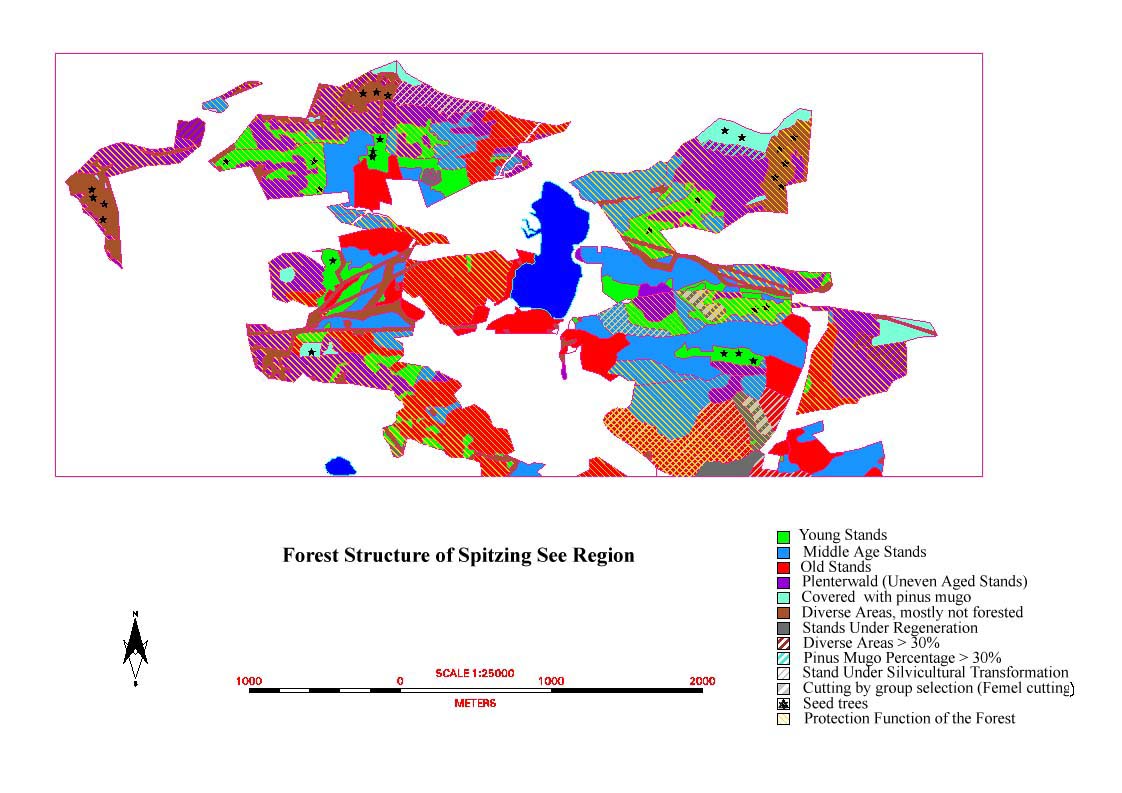
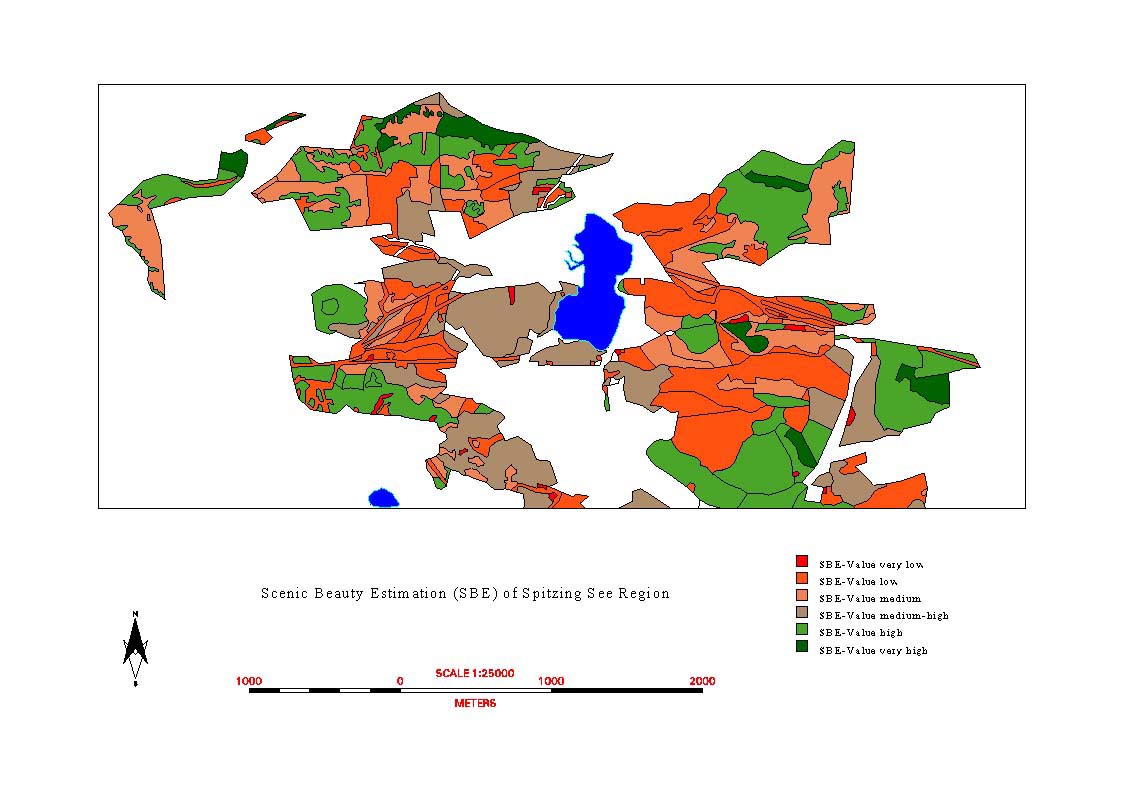
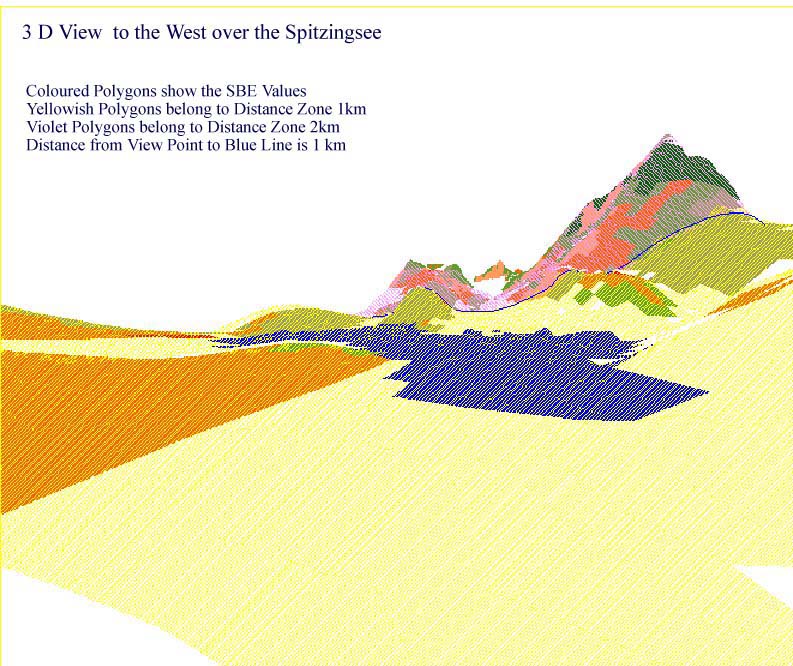
the two-dimensional analysis is the management
of spatial information in points, lines and polygons. They are stored as
pixels (raster) or vectors. Two dimensional are for instance the analysis
and display of distance zones, landuse and landcover, the location of key
view points, accessibility of areas by road networks etc.
-
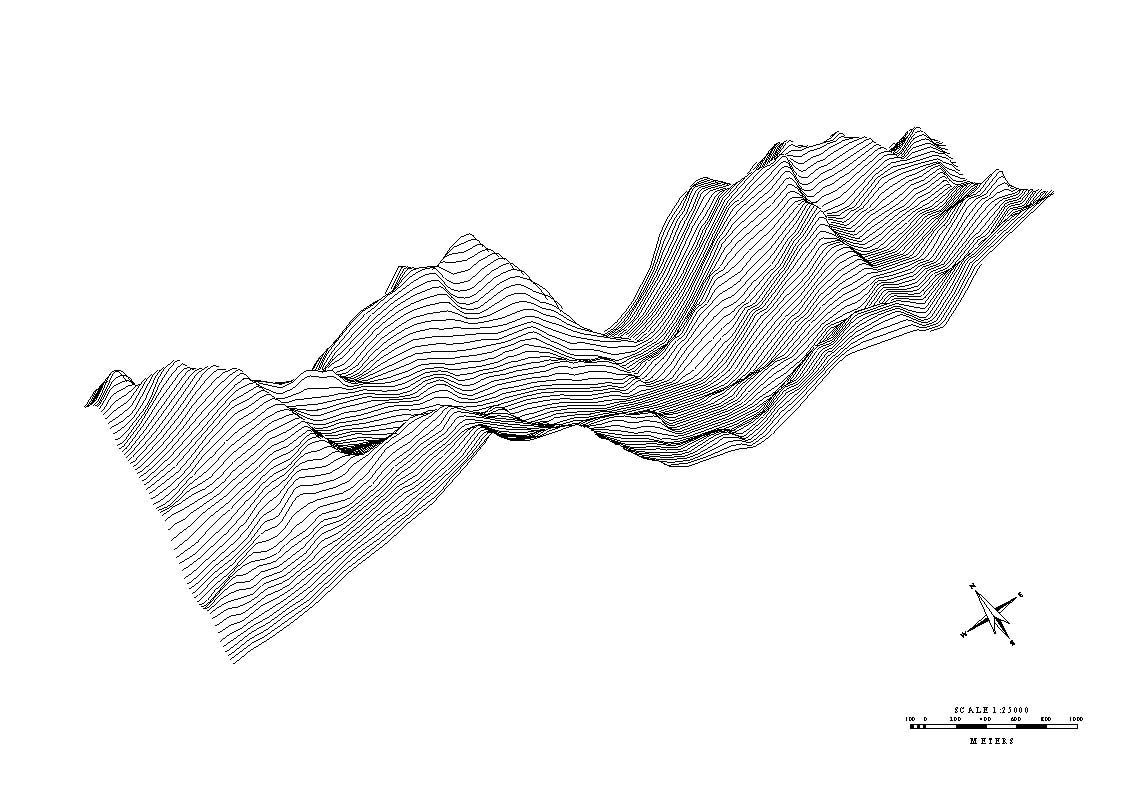
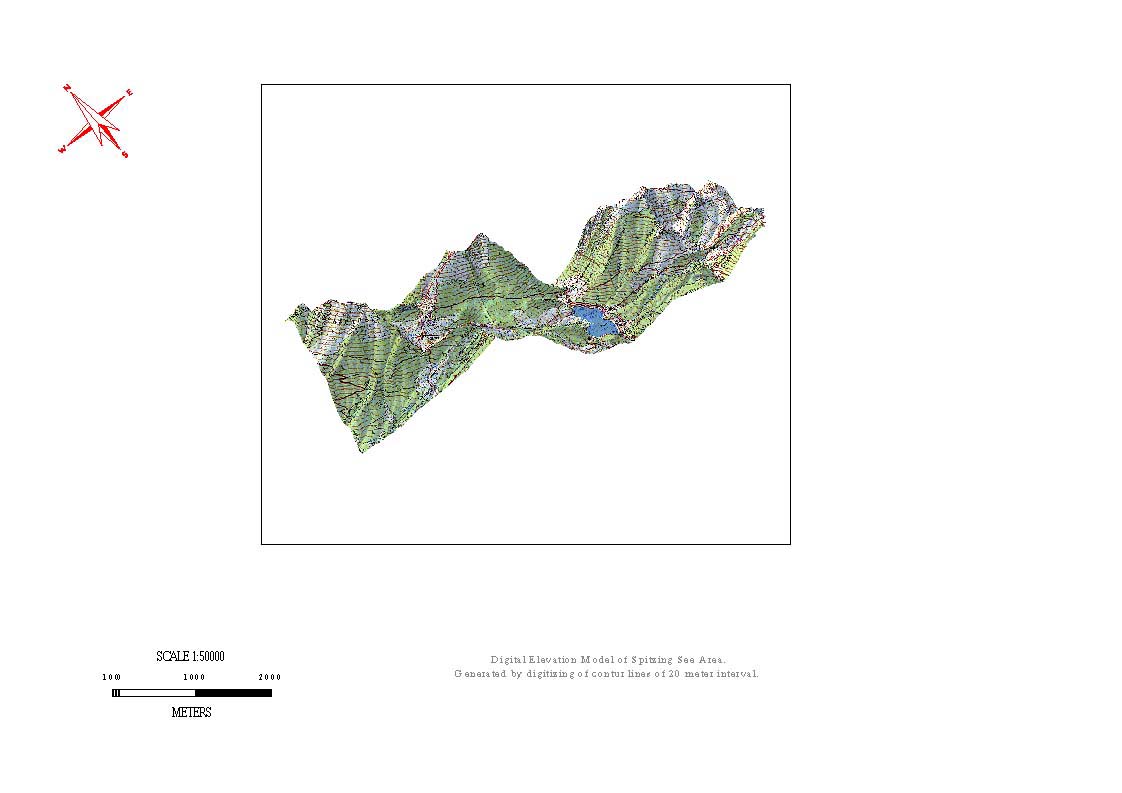
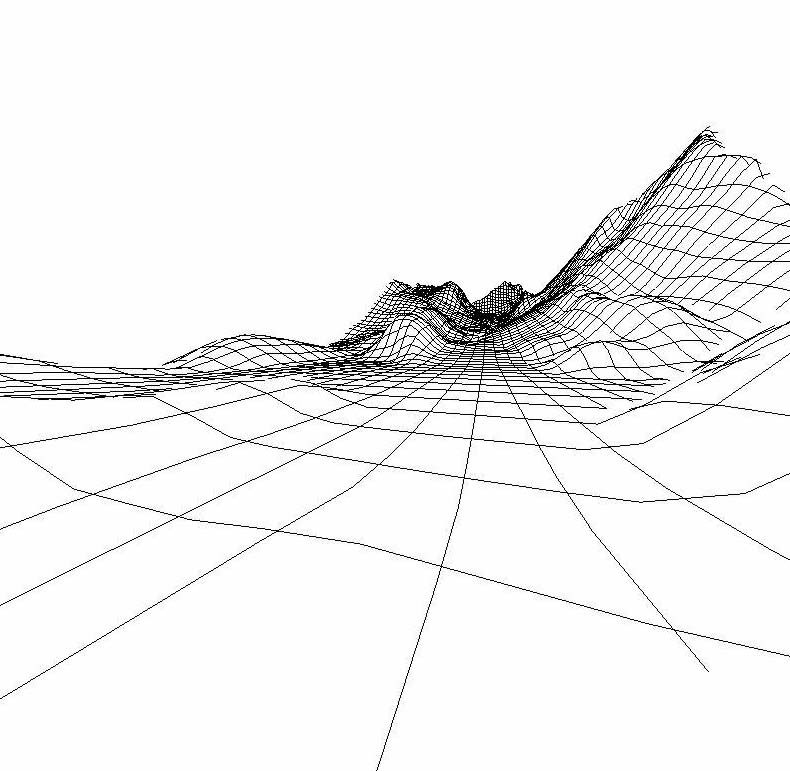
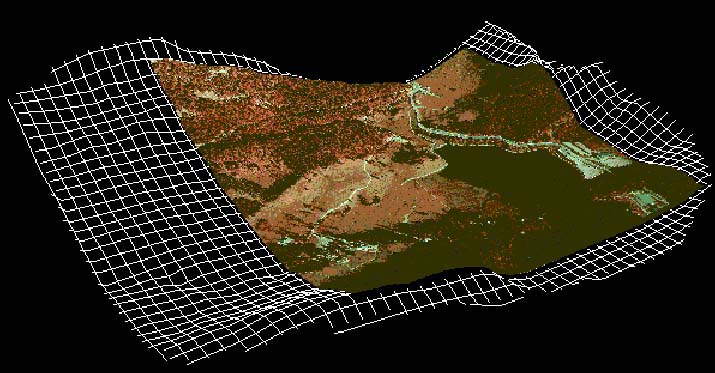
the three-dimensional analysis is the management
of spatial elevation models. Digital Elevation Models (DEM) are generated
as Grids (raster GIS) or as TINs. Grids are used for 3 dimensional processes
which calculate the value of every pixel, e.g. surface calculations and
visibilty analysis. TINs are needed for the realistic display of views
or of flights over the landscape in real time. The VRML format, which is
common on the internet is based on TINs.
-
Grid and TIN from Burggen:
C.
Multi Media
Multi Media comprises the analysis and display
of
-
images
-
sound and
-
animated images (videos, Virtual Reality, GIF
animations).
All partners put emphasis on the use of the
image processing system "Photoshop" to simulate design proposals and future
scenarios in a photorealistic. Manipulated images had been used in the
public survey, to assess the public attitude towards different landscape
and forest types and different design proposals (see internet survey).
-
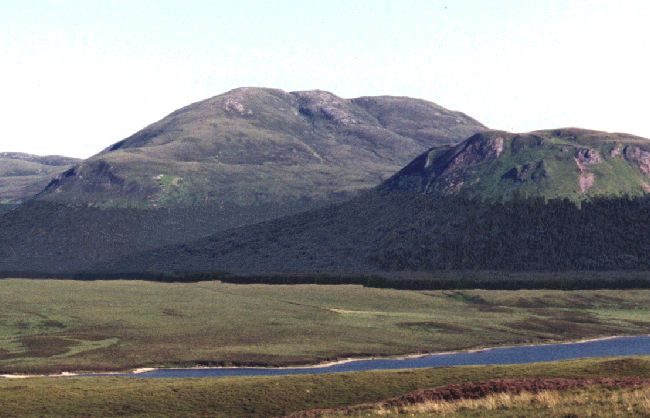
Scotland and Visual Force Theorie
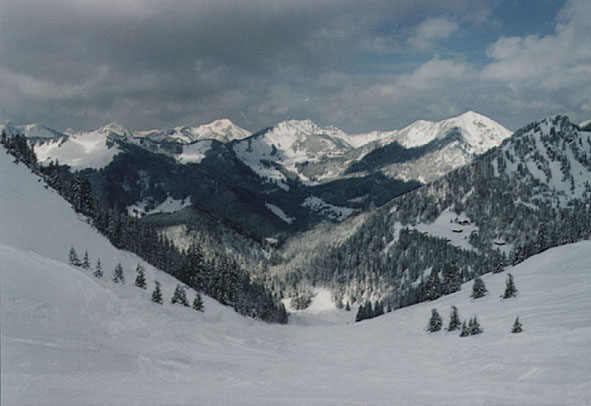
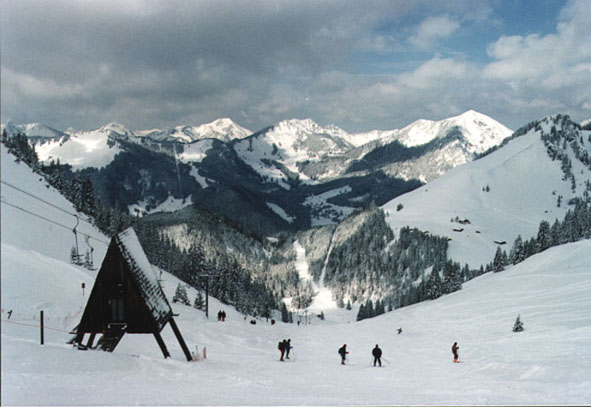
-
Bavarian Alps and Down Slope Skiing
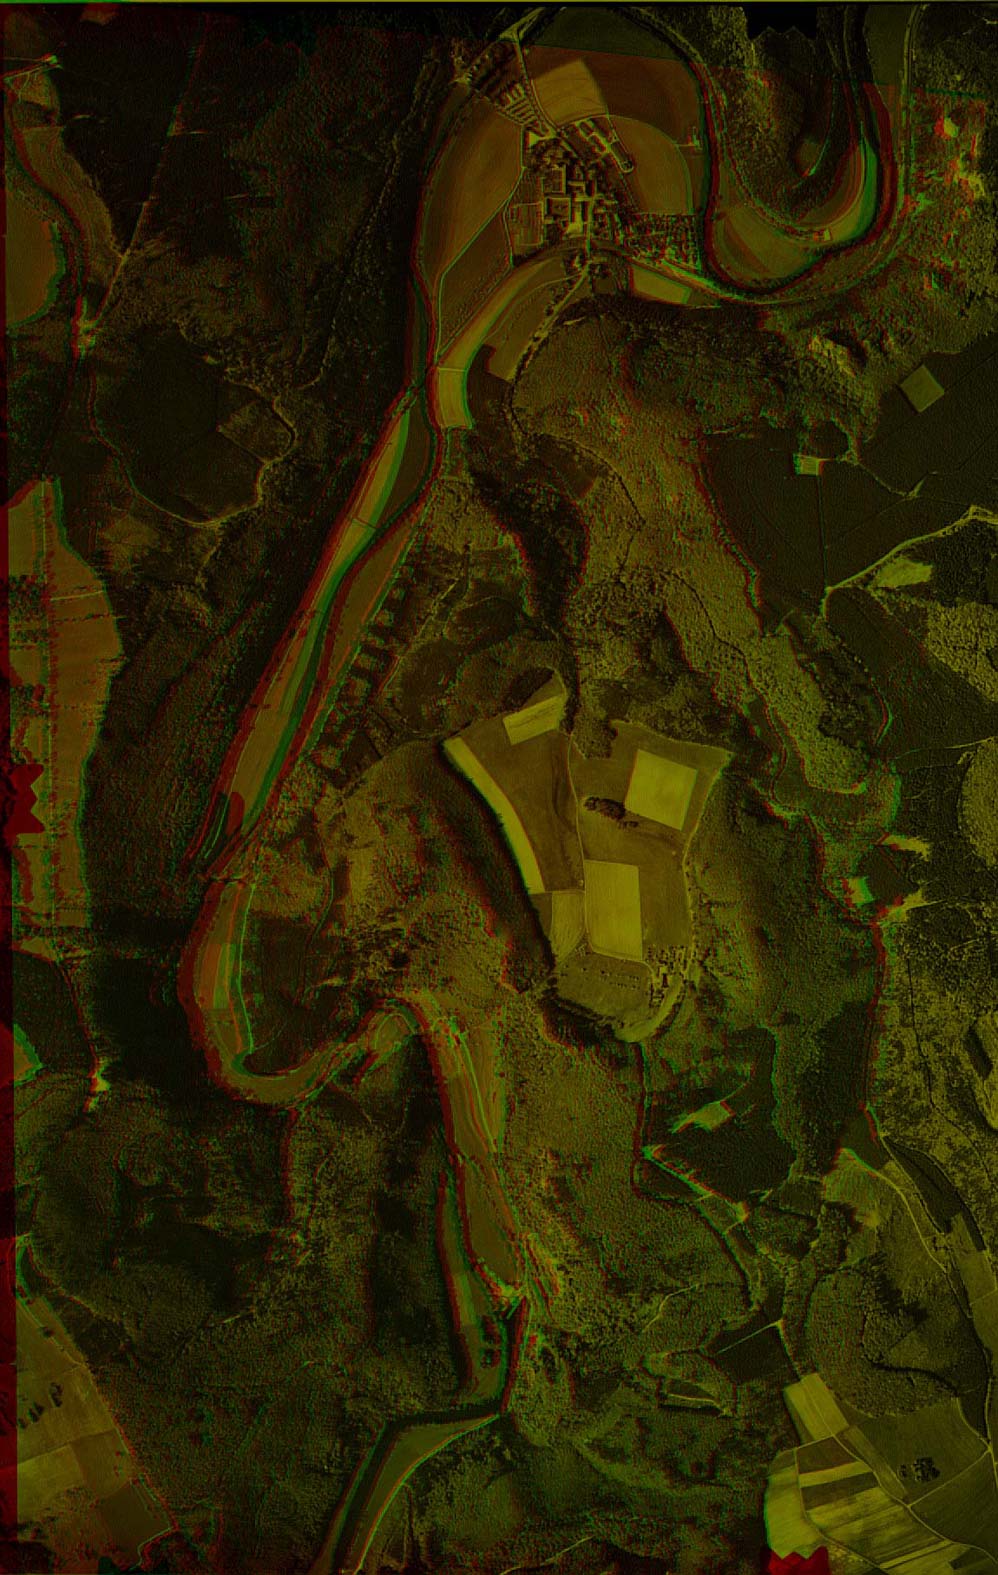
The photogrammetric process of anaglyph images
had been tested to increase the spatial impression of aerial photos
The German team additionally researched the
capabilities of sound, videos, Virtual Reality and GIF animations in order
to transform natural landscape impressions to a digital format, that can
be used in a GIS.
-
Sound Video of FORAM Study Area
-
Virtual Landscape Model of FORAM Study Area
(Netscape 3.0 Gold or VRML Viewer needed)
-
GIF animation show the visual impact of afforestations
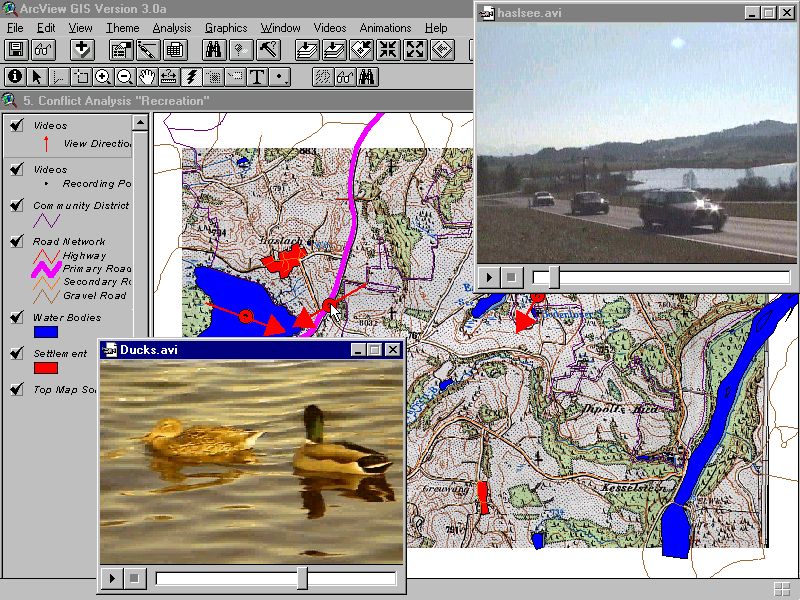
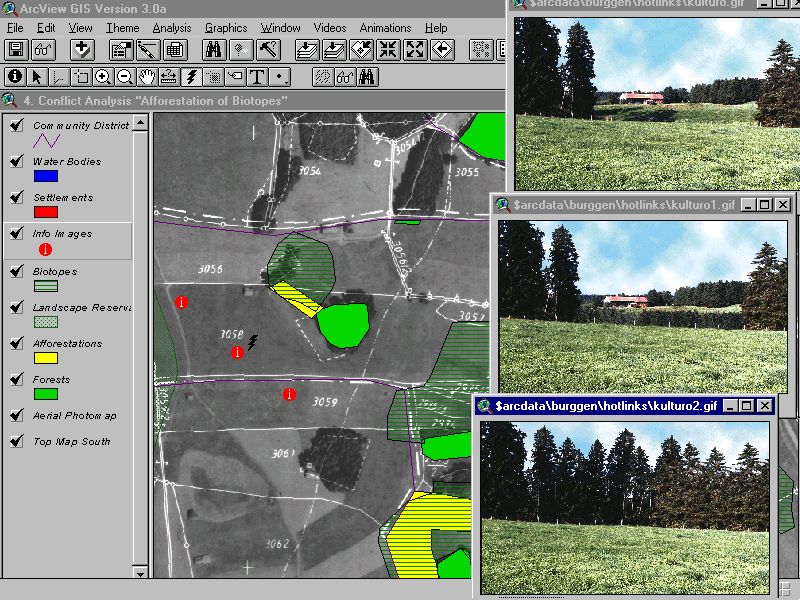
Multi
Media GIS
The combination of Internet, GIS and Multi
Media resulted in the proposed Multi Media GIS concept (see draft
of web article) which is chiefly based on ArcView 3.0. This GIS package
is a user friendly and affordable software for landscape architects and
it is useful for the realisation of their design proposals.
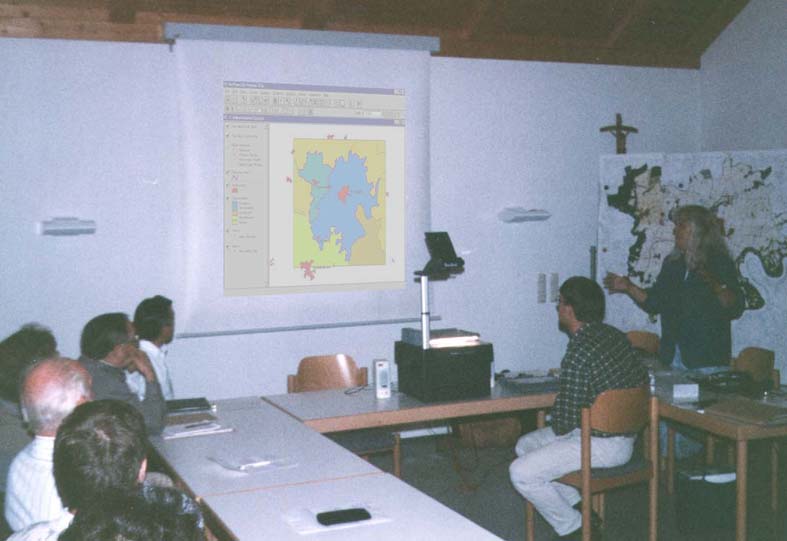
It can be used in-house and in public
meetings
-
to mediate conflicts in landuse planning (ex.
1, ex. 2)
-
to do analysis on demand (ex.1)
-
to present design proposals convincingly and
-
to improve the acceptance of planning results
Discussion
-
The acceptability of GIS and New Digital Media
(sample plot)
-
Release, licensing and copyright of digital
data
-
Internet security and virus
problem