 Detailed Visual and
Amenity Design Guidelines for Forestry:
Optimising Rural Resource
Potential (FORAM)
Detailed Visual and
Amenity Design Guidelines for Forestry:
Optimising Rural Resource
Potential (FORAM)
You find here:
Technical
Design of a Multimedia GIS
by Markus Weidenbach
Chair for Landuse Planning and Nature Conservation
Ludwig-Maximilians University Munich
To run all linked files properly
on Windows you need Netscape Gold 3.0 (VRML viewer is included), a MPEG
player (e.g. XingMPEG Player), video player from REAL and a sound card.
Table of Contents
0 List of Linked Figures and Files
2 GIS and Multimedia in Landuse
Planning
2.1 Data Input
2.1.1 Using Existing Data
2.1.2 Digitising Data
2.2 Data Analysis
2.3 Visualisation
and Data Presentation
2.3.1 Videos in Video for Windows Format (*.avi)
2.3.2 Images in JPEG, GIF and TIF Format
2.3.3 Image Animation in GIF Format
2.3.4 ArcInfo Grid
2.3.5 Tables in dBase Format
2.3.6 TIN in VRML Format
3 Data Dissemination
and Data Exchange via Internet
0 List of Linked Figures and Files
-
burg_apr1.jpg: The first so called "View" (Thematic
Map) of the ArcView presentation gives an overview of the Study Area of
the Landscape Master Plan.
-
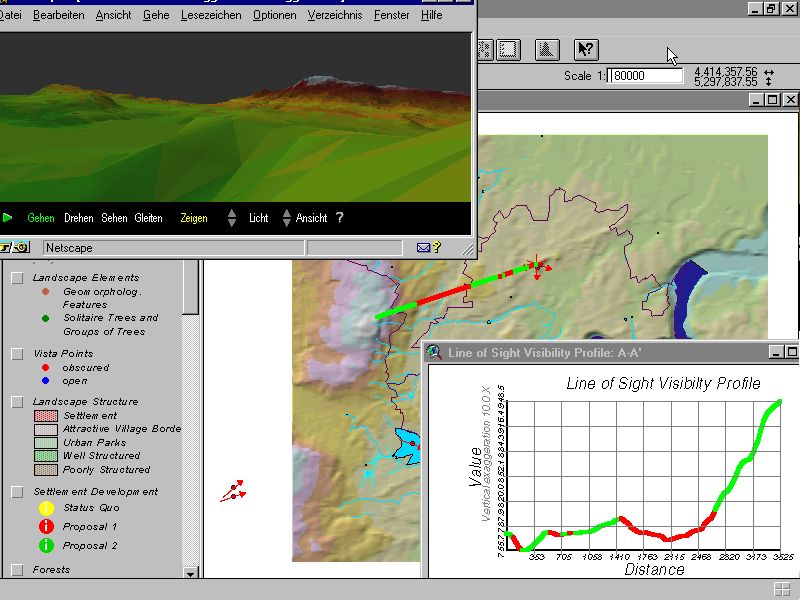
burg_apr2.jpg: The View to analyse landscape
aesthetics by means of visibility calculations (line of sight) and a virtual
reality landscape model of the study area, displayed with Netscape Gold.
-
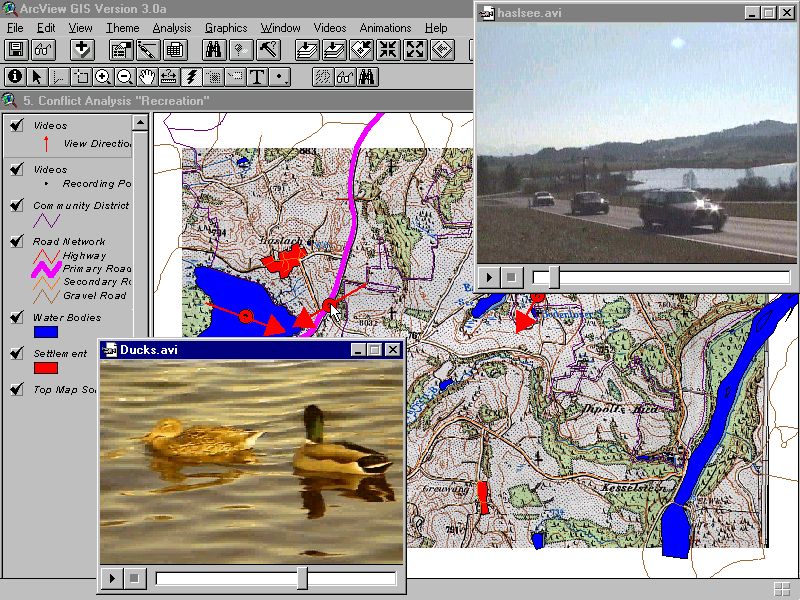
burg_apr3.jpg: View for analysing recreation
quality by means of sound videos to demonstrate the impact of noise.
-
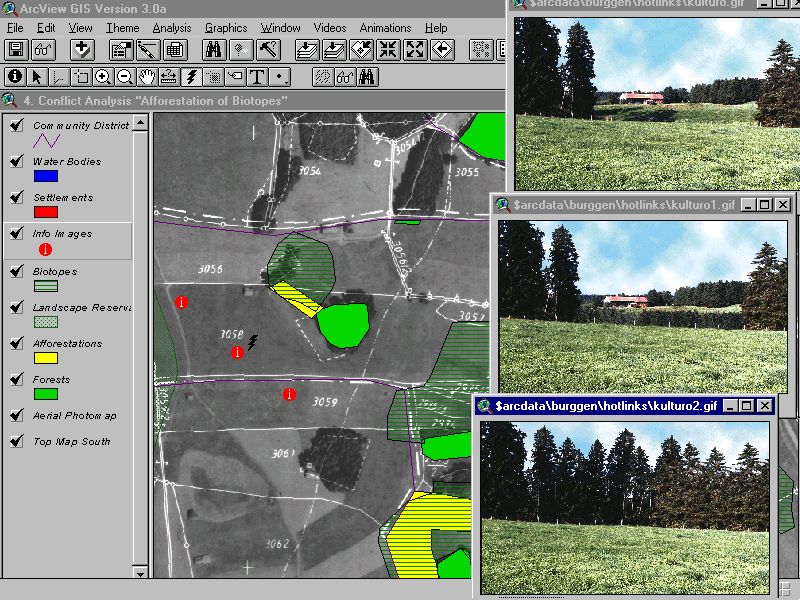
burg_apr4.jpg: View for analysing the impact
of afforestations on the scenery and ecology be means of manipulated images
and orthophotos.
-
burg_apr5.jpg: Detailed view of planning site
in the south
-
burg_apr6.jpg: Detailed view of planning site
with all proposals
-
burg_apr7.jpg: Pulldown menu to start videos
of the study area
-
burg_apr8.jpg: Pulldown menu to start animations
and simulations
-
burg_apr9.jpg: The project window with views
of the Lnadscape Master Plan
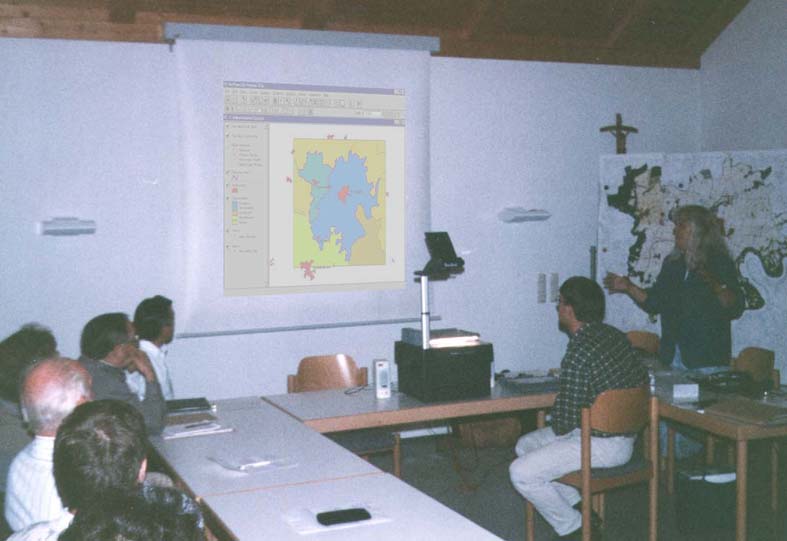
-
gisdemo.jpg: The GIS presentation at a meeting
of the city council
-
Burggen0.wrl: Virtual Reality Landscape Model
of the Study Area
-
ani101.gif: Animation of spruce plantation growth
model
-
ducks.ram: Streaming sound video of ducks in the
study area (requires Real Player, 640 Kb)
-
Dragdrop.avi: Sound Video for Windows (Windows
demo file, 300 Kb)
-
Rocket.mpg: MPEG compressed video demo file
-
Begruess.wav: Sound demo file
-
wei3eng.doc: Downloads the MSWord 7.0 document
GIS and Multimedia in Landuse Planning
Digital data and inter-medial presentations enable planers, citizens and
officials to communicate in a much better way. First experiences with the
proposed multimedia GIS were made in the scope of a Landscape Master Plan
in Bavaria (see gisdemo.jpg). The classic tasks
of GIS are the analysis and alphanumeric and graphic presentation of spatial
data (BILL, FRITSCH 1994). To sensually extend a conventional GIS different
kinds of digital data have to be added, which are perceived by the users
eyes and/or ears. We differentiate 3 groups of data due to their source
and format to define the content of the term Multi Media GIS:
-
Alphanumeric Data
-
Vector Data
-
Sound, Image and Video Data
Like the classic GIS the Multi Media GIS is focused on using vector data
(see BILL, 1996). That data core is supplemented by alphanumeric, sound,
image and video data.
2.1 Data Input
2.1.1 Using Existing Data
At the very beginning of the planning process the existence of available
digital data has to be proved. The official offer of spatial digital data
is still rare in Bavaria. Additionally the price, distribution and licence
policy is often left unclear. Probably the best spatial data for Bavaria
can be found at the State Survey Branch in Munich, which offers different
thematic layers of the official topographic map in the common DXF format.
With the exception of that general data almost all other landscape and
ecology related data has to be digitised by the landscape planers themselves,
which is still very time consuming and expensive.
2.1.2 Digitising Data
There are different ways to record spatial data by oneself:
Alphanumeric Data
-
Key board input of landscape describing information with text processing
or data base software
Vector Data
-
Recording site geometry and site features by photogrammetric means (aerial
stereo photos):
-
Digitising from a Stereo Plotter (e.g. SD 2000 from Leica or Planicomp
from Zeiss) with CAD or GIS software by cursor input on the system screen.
-
Recording sites by means of a conventional stereoscope as a sketch map,
which then has to be digitised on a digi board
-
Recording geometry and features of sites from distorted aerial photos or
adequate terrestrial photos (WARNER, W.S., 1993) by means of the Monoplotting
procedure on the screen or on a digi board.
-
Digitising site geometry and eventually site features from orthophotos
and aerial photo maps on the screen or on a digi board.
-
In-house digitising of field sketches and maps
-
Digital recording of site geometry and site features in the field by means
of Pen computers an adequate software (KIAS, 1996)
Sound, Image and Video Data
-
Analogue or digital sound recording in the field, additionally in-house
digitising and sound processing with sound card and audio software if necessary.
-
Scanning maps as background information; analogue or digital photo shots
in the field, subsequent in-house image processing
-
Analogue sound-video recording in the field, digitising and computer processing
with video capture card and video processing software.
In practice the ideal way of data recording is often not possible since
there are different data sources and formats which has to be integrated
into the GIS. For instance, besides the photogrammetric landuse interpretation
based on orthophotos or aerial stereo photo models, the field mapping of
landscape features based on existing maps still remains necessary.
2.2 Data Analysis
Digital data enable the landscape planer to present his results in a transparent
way even with a permanently increasing amount of planing data. Chiefly
the possibility to overlay different thematic maps play an important role.
In this way landuse conflicts can be quickly displayed numerically and
graphically with high transparency and clearness for the user, which cant
be achieved by the conventional cartographic illustration. Turning different
map layers on or off helps additionally to demonstrate and mediate separate
planning steps. An important advantage of digital data and GIS is the analysis
of 3 dimensional landscape models, which are the basis for visibility,
slope, aspect, line of sight or watershed calculations (see burg_apr2).
The time related analysis of the scenery can be done by implementing photorealistic
simulations of alternative stages into the GIS or by linking multi-temporal
video or photo sets.
2.3 Visualisation
and Data Presentation
As mentioned above a transparent Landscape Master Plan is essential for
the acceptance of designing proposals. A client friendly analysis and demonstration
of planning results has become an important factor for landscape planners.
A GIS which is able to simulate geo-referenced landscape stimuli is a suitable
tool to produce a general conscious for relevant planning aspects. The
multimedia computer presentation facilitates the illustration of often
very complex planning goals and creates a sensitivity for landscape related
conflicts. Only if the citizens are aware of those problems, they are willed
to support the planning, which is essential for the sustainable realisation
of planned proposals and measures in the field.
We have chosen the GIS software ArcView 3.0 to present and visualise
the data of the Landscape Master Plan (see gisdemo.jpg
and burg_apr9). ArcView runs with Windows95
and comprises all multimedia capabilities of Windows95. The hardware components
are a Pentium 133 MHz with 40 MB RAM (SiNix Notebook Mobile 700), sound
card and two external speakers.
To project the data we put the removable LCD display of the Laptop
on a regular Overhead Projector or if available we used a Digital Light
Projector.
The data listed below were added to the vector data in ArcView. The
vector data are ArcInfo coverages, ArcView shape files and vectors in Drawing
Exchange Format (DXF).
2.3.1 Videos in Video for Windows Format (*.avi)
You start the Video interactively by mouse-clicking on the mapped standpoint,
from where the video has been taken or from a programmed pull-down
menu. In case of a sound video you hear all sounds at the standpoint.
The mouse-click runs an ArcView Avenue script, which starts Windows multimedia
player (Mplayer.exe) with the relevant *.avi file (see burg_apr3
).
2.3.2 Images in JPEG, GIF and TIF Format
Background information are b/w topographic maps and orthophotos, scanned
with 200 dots per inch (dpi) in TIF format and added as a separate ArcView
Theme to the active View. Scanned (150 dpi) colour photos from the study
area were added to selected themes as so called hotlinks" (programmed
link to a file). You can display them on the screen by mouse-clicking on
the respective theme, which starts another Avenue script. The photos chiefly
help to show certain landscape aspects in a photorealistic way. They were
partly manipulated with Photoshop 3.0 to illustrate the interference by
man and the impact on the scenery, e.g. the extension of urban areas or
the growth of spruce plantations (see burg_apr4).
2.3.3 Image Animation in GIF Format
To illustrate temporary landscape changes, e.g. the growth of afforestations,
colour photos were successively altered with Photoshop and were composed
to an animation by means of the software Ulead GIF Animator. The animation
is shown with Netscape Navigator Gold 3.0, which is run by an Avenue script
after selecting it in a pull-down menu of ArcView.
Netscape Gold 3.0 user may download and run the original
GIF animation (0.9 MB !)
2.3.4 ArcInfo Grid
To give a three dimensional landscape impression a so called shaded grid
has been calculated with ArcInfo based on acquired elevation data from
the survey branch. The shaded grid is added as a separate ArcView Theme.
If the extension Spatial Analyst" is installed, the shaded grid can be
calculated with ArcView directly (see burg_apr2).
2.3.5 Tables in dBase Format
All spatial alphanumeric data can be added as dBase tables to the feature
(polygons, points, lines) attribute tables in ArcView. In this way ArcView
enables the user to query all features which has been added to the polygons,
points and lines by mouse-clicking on it. For instance it could be helpful
to add external ecological (biotope mapping) or sociological (census) data
to the mapped sites.
2.3.6 TIN in VRML Format
ArcInfo tins (Triangulated Irregular Network), which graphically describes
space conditions in 3 dimensions, can be transformed into a 3D landscape
model in VRML (Virtual Reality Modelling Language) by means of the ArcInfo
command TIN2VRML. The VRML landscape model can be displayed and navigated
with Netscape Gold, which even allows a realistic flight through the landscape.
The model is run by an Avenue script, which starts Netscape after selecting
it in a pull-down menu of ArcView. Netscape
Gold 3.0 user may download and run the original VRML
Landscape Model (1.4 MB !).
3 Data Dissemination
and Data Exchange via Internet
Data storage is an essential point in data management, it is vital for
the further maintenance and exchange. Commonly used media and data formats
are a good choice to grant for an easy data handling on a longer term.
The ISO standardised CD ROM and system independent data formats like most
of the files on the Internet fulfil a certain standard and have a longer
life expectancy" than others. Data burned on a CD ROM are write protected
and can be read from most of the PCs, Apple Macs and Workstations to start
a digital presentation or to copy and maintain the planning data.
An important advantage of digital master plans is the possibility to
send the data via networks like the Internet, Intranet or Extranet.
The publication of the master plan on the Internet instead informs
all interested people around the clock. The reception of information is
no more limited to office-hours, gatherings and official meetings late
in the evening as usual. Hence the publication of planning results on the
Internet in addition to the legal time limits make sense. Even filing an
objection by e-mail is possible but needs to be discussed from a legal
point of view.
Answers to the question of the technical feasibility can be found on
the Internet itself. The file formats on the World Wide Web have reached
a certain standard, which is even compatible to different platforms and
operating systems. Most of the Internet Browser are able to read JPEG and
GIF images and to reply sound (*.wav) or video
(*.mpg, *.avi, *.ram)
files. Implemented small programmes of the latest Browser generations (Plug-Ins
or X-Active) help to navigate three dimensional landscape models in real
time, to play sound and music files, to make a phone call via Internet
or to send e-mails.
Meanwhile the necessary assisting programmes and Java scripts to display
and query digital maps on the WWW can be downloaded from the net. For instance
user shells from Autodesk (www.mapguide.com)
and Esri
(www.esri.com/base/products/internetmaps/internetmaps.html) to receive
and read vector and GIF data. The zoom command of the shells enables the
receiver to ask for more detailed data from the server, which delivers
the information dependent on the chosen scale. Additionally polygons and
points of the online map can be linked with reports or tables.
Markus Weidenbach
Tel.: 08161-71-4665
Fax: 08161-71-4671
E-mail: foram@abies.lnn.forst.uni-muenchen.de
Designed by M. Weidenbach
We count our visitors since 24. Feb. 1998