Multimedia GIS: A New Tool For Landuse Planning
Markus Weidenbach
Chair for Landuse Planning and Nature Conservation
Ludwig-Maximilians University, Munich
Am Hochanger 13
D-85354 Freising
weidenba@forst.uni-muenchen.de
Go to FORAM Design Project
-
Ulrike Pröbstl
Arbeitsgruppe für Landnutzungsplanung,
Landschaftsökologie und Landschaftsgestaltung
St. Andrä-Str. 8
D-82398 Etting - Polling
Ulrike.Proebstl@t-online.de
Abstract
This article describes the potential for using Geographic Information Systems
(GIS) coupled with multimedia technologies to improve the landuse planning
process. The authors demonstrate, using an actual Landscape Master Plan
for a rural community in Upper Bavaria (Germany) how multimedia and GIS
technologies can be used to improve the communication between a landscape
architect and the local people. The technical details on the "multimedia-enhanced
GIS and the procedures used to collect and incorporate the digital data
are described. Several computer screen captures from the ArcView
GIS presentation software illustrate the information that can be displayed
using a multimedia GIS.
This article also discusses how the Internet could be used to further
improve communication between all parties involved in a landuse planning
process.
Finally, preliminary results are presented from a study which explored
the acceptability of using multimedia, GIS and Internet technologies in
landuse planning. That study involved both landscape architects and local
citizens.
Additional graphics which supplement this article are available on
the Internet.
Key words:
landuse planning, multimedia GIS, citizen participation, Internet technology
Introduction
The Landscape Master Plan (LMP) is a central element of landuse planning
in Germany (Kiemstedt 1994). It is one component of what is known as the
"Land Use Plan for a community, and it serves a variety of purposes:
-
It is a repository for information on the region and its community. It
includes, for example, information on soil conditions, on the quality of
water resources, and on all officially registered biotopes. The LMP contains
both current and historical maps which show how the region has evolved
over time.
-
It gives a brief overview of the current form of landuse in the region
and discusses trends in development.
-
It helps landscape architects identify potential landuse conflicts through
analysis of: (a) the information contained in the LMP and (b) the interests
of the local people. Examples of possible conflicts include: planned afforestations
in swampy areas which would destroy valuable biotopes, or new urban development
in sensitive parts of the ecosystem.
-
It provides a framework for the landscape architect who, working in consultation
with the various stakeholders, must provide workable solutions to landuse
conflicts, as well as prepare guidelines for future development in the
region (over about a 15 year timeframe).
Once accepted by the local authorities, the new LMP (which incorporates
the landscape architect's proposals and guidelines) is then integrated
into the Land Use Plan for the community. The landscape architect's proposals
could include: new protected areas, new housing areas, zones for recultivation
and tree planting to improve the landscape aesthetics. The Land Use Plan
is a mandatory planning instrument for the local authorities.
However, the contents of this 20 year old planning instrument, as well
as the planning process itself, are in a constant state of evolution. The
planning conditions and circumstances have changed significantly over the
years. In response to these changes, the LMP has evolved from a "service-plan"
completely designed by a landscape architect, to an instrument in which
public participation plays an important role. It has become a focal point
for discussions on landuse policy, on ecological issues, and on planning
guidelines and objectives.
The Bavarian Ministry for Landscape
Development and Environment now regards a democratic and "citizen friendly"
process as the central element in improving landuse planning in Bavaria
(Bayerisches Staatsministerium für Landesentwicklung und Umweltfragen
1996). Whether or not pre-defined planning goals are achieved is very much
dependent on the way in which the issues of landscape aesthetics and ecology
(which often compete with other public and private demands) are presented
to the town council and citizens.
But not only has the planning process changed. New demands on landuse
planning have arisen. Landscape architects can no longer restrict their
focus to issues of ecological integrity and landscape aesthetics. The resolution
of landuse conflicts and the establishment of long term objectives are
now essential tasks in the landuse planning process. Also, there is an
increasing amount of data which must be integrated into the planning process.
For example, today we have access to more ecological information - information
such as the distribution and quality of biotopes, the presence of endangered
species, the quality of water and the soil conditions. Innovative landuse
planning should therefore meet new standards in at least two areas:
-
the handling and analysis of an increasingly large and complex body of
data, and
-
the presentation and clear communication of that data to stakeholders.
With respect to a democratic and citizen-friendly landuse planning process
(Luz 1995), the use of GIS in conjunction with multimedia and Internet
technologies offers great potential for improving the clarity of data presentation
and in communicating landuse decisions to the community (Cámara
1997, Raper 1997a, Schmidt-Belz et. al. 1997, Shiffer 1995). Digital technologies
can help planners, citizens and officials to communicate in a much better
way. Where people have been restricted to using analogue, paper-based maps,
they can now benefit from the power of GIS and multimedia, requiring only
a laptop computer, projector and screen. This is very important for the
planning process, because guidelines and proposals for ecologically-sound
development will be integrated into the community's Land Use Plan only
if the community council accepts them. Consequently, an important part
of our research was to identify the methodologies and underlying computer
technologies which would be not only necessary, but also available to all
landscape architects in Germany, whether they work in a large urban centre
or a small village in Bavaria. In addition to feasibility, two areas were
of especial interest to us:
-
the reaction of landscape planners to the proposed approach, and
-
the usefulness of this approach to a local community and its citizens.
This study was undertaken as part of the EU funded project, Detailed Visual
and Amenity Design Guidelines for Forestry: Optimising Rural Resource Potential
(FORAM), at the Chair for Landuse Planning and Nature Conservation of the
Ludwig-Maximilians University Munich (Weidenbach & Wild 1997). This
initial investigation into the use of multimedia GIS uses an actual Bavarian
LMP as its basis.
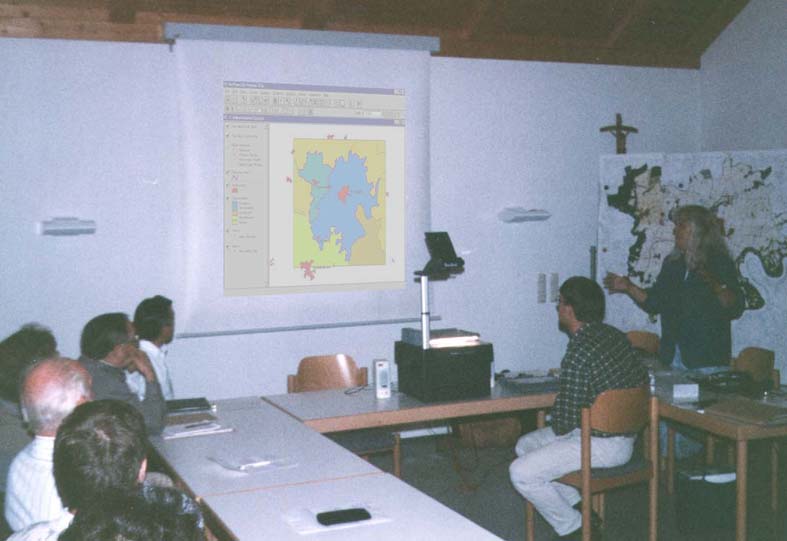 Fig. 1. GIS-based presentation of the Landscape Master Plan to the community
council of the small Bavarian village, Burggen, using a laptop computer
and overhead projector.
Fig. 1. GIS-based presentation of the Landscape Master Plan to the community
council of the small Bavarian village, Burggen, using a laptop computer
and overhead projector.
The Role of GIS in the Planning Process
Nowadays, landscape architects commonly use computers to write reports,
maintain databases and perform spreadsheet calculations. The extension
of digital technologies to activities in landuse planning (e.g., to cartographic
inventories, assessment, planning, and to the presentation of geo-referenced
spatial data ) is the next logical step.
The classic tasks of GIS are the analysis and alphanumeric/graphic
presentation of spatial data (Bill & Fritsch 1994, Haines-Young et
al.1993, Burrough 1986). However, the functionality of a conventional GIS
can be significantly enhanced by the addition of several new data types.
According to Bill 1996, we can differentiate 3 groups of data based on
data source and format:
-
alphanumeric data;
-
vector and raster GIS data; and
-
sound; image and video data.
Like the classic GIS, the enhanced "multimedia GIS is focused on using
vector and raster data. That data core is supplemented by alphanumeric,
sound, image and video data.
Data Input
At the beginning of the planning process, the availability of digital data
must be determined. The release of spatial digital data is still rare in
Bavaria. Additionally, the price, distribution and licensing policy is
often left unclear. Probably the best spatial data for Bavaria can be found
at the State Survey Branch in Munich, which offers different thematic layers
of the official topographic map in the common DXF format (Drawing Exchange
Format). With the exception of this general data, almost all other landuse
and ecology-related data must be digitised by the landscape planners themselves
- a process which is still very time-consuming and expensive.
Spatial data can be digitised in various ways: Alphanumeric data can
be recorded using text processing or database software. Vector and raster
GIS data can be digitised from orthophotos, maps or sketches and - according
to Warner 1993 - even from distorted terrestrial photos (an elevation model
is needed for this process). New methodologies have been researched by
Kias 1996 to digitise site data directly in the field using portable pen
computers and geo-referenced background information such as digital maps
or orthophotos. Sound, photos and videos can be recorded in the field by
means of digital or analogue devices such as standard video recorders and
35mm cameras.
The spatial accuracy of digitised polygons, points and lines is one
of the most important issues in GIS. Accuracy here depends primarily on
the quality of the available, basic information. The greatest accuracy
can be achieved by digitising all sites from aerial stereo photos - something
which is not always practical since the planner must integrate a variety
of data sources and formats into the GIS. For instance, in addition to
the photogrammetric landuse interpretation based on orthophotos or aerial
stereo photo models, the mapping of landscape features from existing paper
maps still remains necessary. Those maps are often not up-to-date. Further,
their scale may differ from the scale of the LMP, and this can introduce
additional inaccuracies.
Interactive Data Analysis on Demand
The ability of GIS to analyse ecological and landscape-related spatial
data has often been discussed and demonstrated (Reis Machado & Ahern
1997, Bayerische Akademie für Naturschutz und Landschaftspflege 1996,
Haines-Young et al. 1993). In our research, we were primarily interested
in the ability of GIS to do interactive analysis - that is, analysis
on demand. For instance, during a presentation to a local community, a
member of the audience may wish to know if any officially registered biotope
is located on his/her property, its ecological features and/or its exact
size.
Another advantage of using digital data and GIS is the ability to analyse
3-dimensional landscape models which form the basis for visibility, slope,
aspect, line-of-sight or watershed calculations. Queries of this nature
can also be handled, providing the necessary base data is available (see
Fig. 4).
Multimedia elements can play an important role in visual analysis. For
example, a photo taken from a registered viewpoint which appears on the
screen when that viewpoint is clicked, completes the visibility analysis.
Also, a demonstration of how scenery will change over time can be done
by using the multimedia GIS to display photorealistic simulations of successive
stages of development (see Fig. 3), or by linking video clips or photo
sets (for example, a sequence of images taken over the past several decades).
Using the data from the LMP we chose for this study, we used this capability
to answer a question on how an afforestation might influence the scenery.
We generated a photo animation which ran as a
video and showed how the landscape changed as the young stand evolved to
become a mature forest (www.lnn.forst.uni-muenchen.de/daten/foram/mmgis/ani101.gif).
The use of digital technologies enables the landscape architect to
present information to audiences in a flexible and transparent way, even
though the amount and complexity of the underlying data continues to increase.
One example here is the ability of GIS to overlay selected thematic maps,
allowing the viewer to see complex relationships at a glance. Using this
technique, landuse conflicts can be quickly identified, and displayed with
a level of clarity and legibility that cannot be achieved by analogue cartographic
illustrations. Additionally, turning different map layers on or off can
be useful in illustrating the various steps in the planning process.
Visualisation and Data Presentation
As mentioned above, a Landscape Master Plan that is easily understood is
essential for the acceptance of design proposals. A client-friendly analysis
and presentation of planning results has become an important factor in
successful landuse planning. A GIS which is able to simulate geo-referenced
landscape stimuli is a suitable tool for creating a general awareness of
the relevant planning issues. The multimedia computer presentation possible
with such a system facilitates the illustration of often very complex planning
goals and creates a sensitivity for landuse related conflicts. Sustainable
implementation of a landuse plan can only be achieved if citizens are fully
aware of all the issues and can make informed decisions.
We selected the GIS software ArcView 3.0 with the Spatial Analyst
extension and Netscape Gold 3.0 to present the data in the LMP of
a rural community in Upper Bavaria. ArcView runs on Windows95 and encompasses
all the multimedia functionality of the platform. We used a laptop computer
with two external speakers for our presentation. To project the data on
the screen we placed the removable LCD display of the laptop onto a standard
overhead projector.
The following paragraphs describe the digital data components of the
LMP. The various thematic and planning maps were presented as separate
"views" using the ArcView software. The vector data were ArcInfo coverages,
ArcView shape files and vectors in Drawing Exchange Format (DXF). The following
data types were added to the vector data in ArcView:
-
tables in dBase format - necessary for the display of site-specific
data via a mouse click on the site;
-
videos in Video for Windows format - used to provide a visual and
acoustic landscape impression (the videos were related to the mapped recording
point);
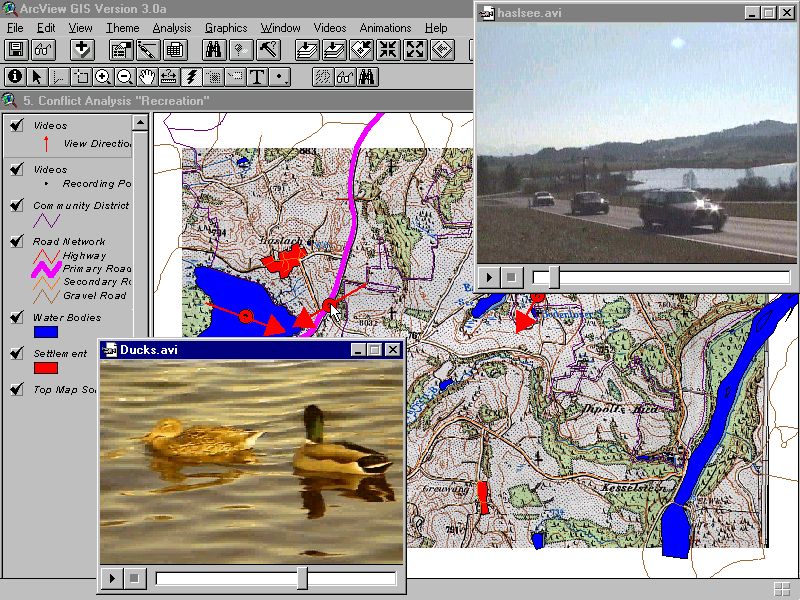
Fig. 2. Videos with sound illustrate the conflicts with respect
to recreation
-
images in JPEG, GIF and TIFF format - used as background information (b/w
topographical maps and orthophotos) and illustrate areas of interest in
a photorealistic way (terrestrial, site-related colour photos);
-
image animation in GIF format - used to illustrate changes in the landscape
over time;
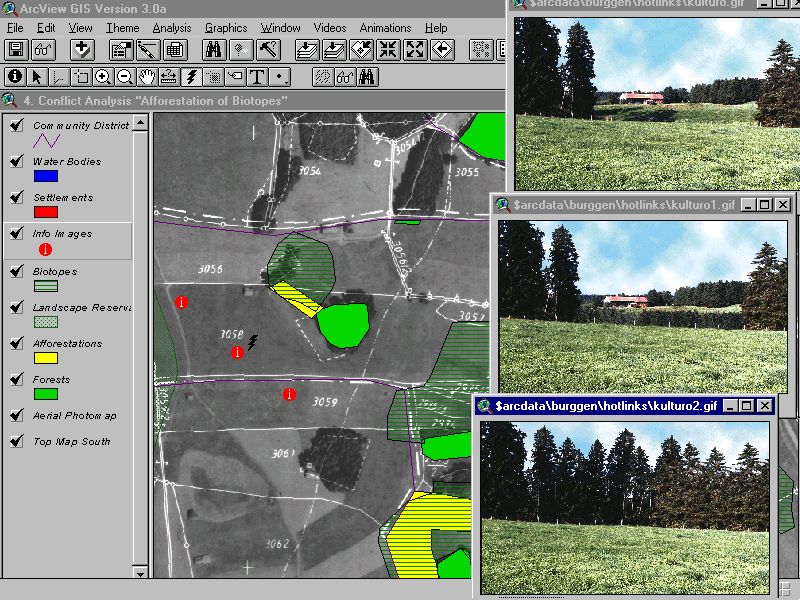
Fig. 3. Photoshop simulation of growth of afforestations
helps to illustrate future conflicts
-
an ArcInfo Shaded Grid - gives a 3-dimensional landscape impression;
-
an ArcInfo TIN (Triangulated Irregular Network) in VRML format (Virtual
Reality Modelling Language) - describes space conditions in 3 dimensions
and allows a realistic, interactive flight through the landscape even in
the WWW. You can run the VRML model from the Internet using, for example,
Netscape Gold 3.0 (www.lnn.forst.uni-muenchen.de/daten/foram/mmgis/Burggen0.wrl).
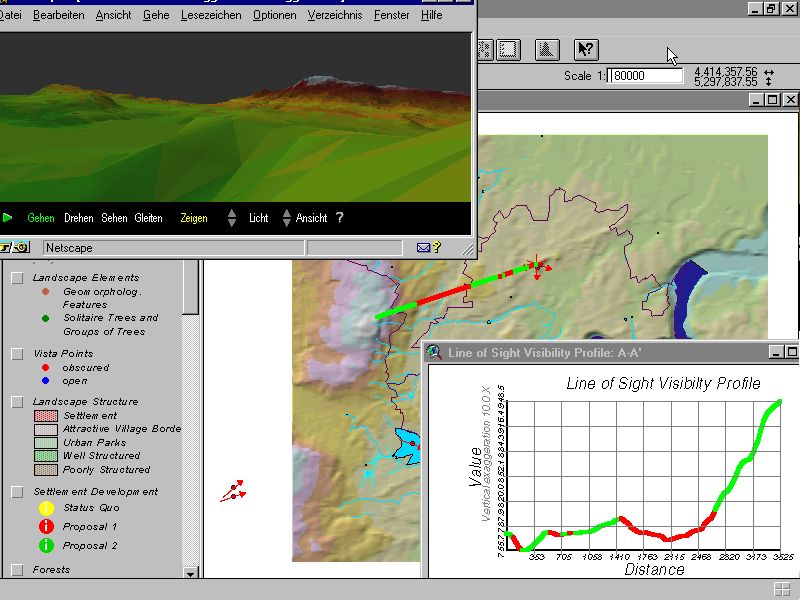
Fig. 4. Three-dimensional landscape analysis with line of sight
calculations (lower right) and a Virtual Reality Landscape Model (upper
left).
Data Dissemination and Exchange via the Internet
In this section we outline our vision for the future evolution of landuse
planning. Some of what we describe is already a reality. Other elements
(such as an interactive LMP on the Internet) are likely to become a reality
very soon, given the speed with which Internet technologies are evolving.
Data storage is a central issue in the maintenance and exchange of digital
material. Commonly used storage media and data formats will simplify data
handling in the longer term. System-independent data formats, such as most
of those used on the Internet, will likely have a longer "life expectancy"
than other formats. Although there is already a "next generation" CD on
the market (DVD-ROM, Digital Versatile Disk), the ISO standard CD ROM is
still a good choice for the storage of data, since it is in widespread
use. The data encoded on a CD ROM is write-protected and can be read by
most of the newer PC, Macintosh and UNIX workstations.
A key advantage of using digital data is the ability to rapidly exchange
information over networks such as the Internet, as well as over Intranets
and Extranets (Raper 1997b, Strasser & Wasserburger 1997). The increasing
network links between government authorities, landscape architects, communities
and private Internet users, opens new avenues for public participation
and communication between all stakeholders in a landuse planning process
(Werner & Bayerische Staatsregierung 1997). The discussion focuses
on three such groups:
-
the authorities concerned with landscape design and nature conservation;
-
the citizens who live in the study area; and
-
the local communities and their representatives
The landscape architect frequently co-ordinates planning steps with the
responsible authorities, and obtains the basic information required. In
future, the use of digital data could facilitate the information flow between
authorities and the planner via the Internet. Questions and disagreements
over proposed measures could be handled verbally or graphically by e-mail,
using the latest GIS online maps. The final LMP could be submitted to the
responsible authorities digitally over the Internet, thus saving the costs
of copying and mailing paper-based maps and other documents.
Normally, all citizens of a community in the study area are informed
about the planning stages and procedures at public meetings of the community
council. In the federal state of Bavaria, the LMP must be approved by the
community council. There is a legal time limit for citizens to file any
objections. If the proposed LMP were published on the Internet, access
by interested parties would no longer be restricted to office-hours, public
gatherings and official meetings late in the evening, as is now the case.
Thus, Internet publication of the LMP, along with the time limit for public
response, makes good sense. Even filing an objection by e-mail would be
possible, although there are legal issues which would have to be addressed.
Answers to the technical issues of Internet publication can be found
on the Internet itself. The file formats currently in use on the World
Wide Web (WWW) have now become reasonably standard, and can be read by
a wide variety of computers and operating systems. Most Web Browsers are
now able to process JPEG and GIF images, and replay sound (*.wav) or video
(*.mpg, *.avi) files. The recent extension of Browser capabilities (through
Plug-Ins, Java Applets and Scripts or Active-X), enables users to navigate
3-dimensional landscape models most commonly in the VRML-format in real
time, to play sound and music, to make phone calls via the Internet, or
to send e-mail messages directly through the Browser.
The helper programmes and Java scripts required to display and interact
with digital maps on the Web can be downloaded from the Internet. This
includes, for example, the user shells from Autodesk (www.mapguide.com)
and Esri (www.esri.com/base/products/internetmaps/ internetmaps.html) which
can be used to receive and read vector and image (*.GIF) data. The zoom
command of these shells enables the receiver to ask for more detailed data
from the server, which then delivers the information appropriate for the
chosen scale. Additionally polygons and points on the online map can be
linked to reports or tables.
General Acceptance of New Digital Media
Landuse planners have taken their first steps into the digital world. Their
acceptance and expectations of new technologies are important factors in
stimulating the adoption of those technologies. However, using the latest
computer techniques does not necessarily guarantee their acceptance - neither
by professional planners nor by citizens, the "end consumers" of the planners'
work. Many people are still not familiar with computers and, therefore,
might react negatively to the adoption of GIS and digital technologies.
The extent to which these technologies can be successfully implemented
- at least in the near term - is still an open question.
The successful implementation of a multimedia GIS in landuse planning
work depends on its acceptance by two groups:
-
professional landscape architects and planning authorities, the active
users of the technology; and
-
local citizens, the "passive users and "end consumers of the planning
data.
We therefore carried out a study to gather feedback from the two groups,
and learn the extent to which they felt the new technologies might improve
the public planning process (Weidenbach, in preparation). Preliminary results
from that study are presented below.
Material and Methodology
In our study, we used a multimedia GIS to give presentations to five groups
of people. The data we used was from two sources: (1) the previously-mentioned
LMP for the village of Burggen, and (2) a comparable GIS project in the
Upper Danube Valley Nature Park. After the presentations, each group openly
discussed their feelings and general impressions. A questionnaire was then
distributed to collect data for a subsequent statistical analysis. The
results of the survey will be published when that analysis is completed
in mid-1998. In this paper we discuss only the methodology we used, and
present results from several of the group discussions.
Guided discussion with an audience (sometimes called group exploration)
is an essential tool for uncovering emotionally-influenced concerns, fears,
preferences and dislikes, and doing so in a very deep and individual way.
Misunderstandings and the reasons underlying a people's responses can usually
be brought to light. Our methodology was based on similar work done in
May 1997 by Prof. M. Keppler, who researched preferences of forest visitors
as part of the above-mentioned EU FORAM project (Keppler Konsumforschung
GmbH 1997, Weidenbach & Wild 1997). Prior to each of our presentations,
the test group was told that there would be a group discussion following
the presentation, and was therefore asked to follow the presentation very
carefully. These discussions were guided by the authors using a prepared
framework of questions and topics. Some examples follow.
-
How did you feel about our presentation of environmental data using computer
and GIS technologies?
-
Was the presentation attractive? Did you like it?
-
What are the advantages and disadvantages of this type of presentation?
-
Do you see any possibilities for the manipulation of information?
-
Environmental/spatial data may soon be available to everyone on the Internet.
Would you take advantage of this and download landscape-related data?
-
Do you see any problems in this method of data exchange?
Each group discussion took about 30 minutes. Sessions were tape recorded
and written notes were taken.
One important criterion for the selection of study groups was familiarity
with the regions being presented. Three of the five groups had this familiarity.
This was helpful for obtaining critical feedback on the realism and clarity
of the presentation.
The following table summarises our test groups and presentations:
| Date |
Location |
Audience |
n |
Content of Presentation |
| 04.06.97 |
Nature Park Centre Upper Danube Valley in
Beuron |
Participants of symposium: Nature Conservation
and Tourism |
14 |
ArcView project of Nature Park Upper Danube
Valley |
| 11.06.97 |
Community Centre nearby Bruchsal |
Participants of symposium: GIS in landscape
planning |
44 |
ArcView project of Nature Park Upper Danube
Valley |
| 24.06.97 |
Community Centre Burggen in Bavaria |
Public meeting of the community council |
14 |
Landscape Master Plan of the community of
Burggen |
| 04.07.97 |
University of Salzburg |
Participants of GIS symposium: AGIT97 |
32 |
Landscape Master Plan of the community of
Burggen |
| 26.07.97 |
Nature Park Centre Upper Danube Valley in
Beuron |
Participants of student excursion: Upper
Danube Valley |
30 |
ArcView project of Nature Park Upper Danube
Valley |
Table 1. Date, location, audience and content of presentation
For purposes of this article, we will focus on the responses of the
professional planners (from the three symposium groups), and of the citizens
from the village of Burggen. The groups differed mainly by age and profession.
People in the symposium groups were mainly in the 30-50 age group and were
mainly employed or self-employed landscape architects, and government planners.
Most of the people in the Beuron group had no GIS background. GIS experience
was more common in the Bruchsal and Salzburg groups. The citizens of Burggen
were mainly self-employed people and farmers. They were somewhat older
than people in the symposium groups, with a higher percentage of people
in the 45-65 age group. About two thirds of the participants in all groups
were men.
Results of the Group Explorations
The following paragraphs briefly summarise the feedback we received from
four of the five study groups, namely, the citizens from the village Burggen
and the professional planners in the three symposium groups.
In general, feedback on the multimedia GIS presentation was positive.
No one rejected the presentation outright, although there were a number
of critical comments.
Viewing the computer screen projection with its various maps, images,
videos and tables was, for the most part, not a problem for the audience.
Only two people complained that their eyes became exhausted. The generally
positive feedback here probably indicates that people are becoming used
to electronic images, by working increasingly with computers, or perhaps
even from frequent television watching.
Among both landscape architects and citizens, there was high general
acceptance of the new technologies, albeit for two different reasons:
(1) passive acceptance, arising from a feeling of being forced
to use the new technologies (e.g., to compete with other professionals
involved in landuse planning, or because the introduction of these technologies
was seen as inevitable)
(2) active acceptance, arising from a profound conviction that
a multimedia GIS is a useful and powerful tool for communicating landuse-related
data.
The second opinion was most often expressed by people who already had some
experience with GIS (e.g., the symposium groups in Bruchsal and Salzburg).
On the other hand, people who had no prior experience with GIS (chiefly
the symposium group in Beuron and citizens from the village of Burggen)
felt that computers and GIS were tools for the future, rather than for
the present. For the citizens of Burggen, the presentation was novel and
strange. They liked it chiefly because of the ability to present different
themes in succession, and because of the photorealism of the simulations
(e.g., showing the impact of afforestations and new housing developments).
The ability of certain presentation elements (e.g., geo-referenced photos,
videos, shaded and virtual landscape models) to help people visualise impacts
of changes was a frequently mentioned advantage of the multimedia GIS over
analogue maps. Even though the citizens of the village Burggen felt that
the digital technologies improved the clarity of the presentation, most
of them were reluctant to do away with analogue paper maps on the wall!
In summary, both professional landuse planners and lay citizens alike
identified three significant advantages of the multimedia GIS:
-
the flexibility with which the system can display thematic and planning
maps, notably: its ability to: (a) display different themes in succession,
(b) generate map overlays and (c) zoom in and out to a specified level
of detail;
-
the ability of the system to integrate, link and display different types
of data (e.g., tables, videos and images); and
-
the interactive nature of the system (i.e., its ability to handle ad hoc
queries during the presentation).
The citizens of Burggen criticised the quality of the sound videos. They
also expressed a concern that planners could unscrupulously manipulate
data to suit their own ends (for example, by selectively editing a video
clip). In the critical comments from all study groups, there were three
items which repeatedly surfaced:
-
the digital technologies are novel and strange, and people are not yet
familiar with them;
-
the objectivity and credibility of the data is questionable, due to the
possibility of unscrupulous manipulation and the unscientific nature
of the multimedia elements; and
-
the technical quality of certain elements in the presentation (chiefly
videos and images) was criticised.
The professional landscape architects and government officials were asked
about their expectations with respect to multimedia GIS technologies, and
about catalysts and barriers to their adoption. Self-employed landscape
architects especially expressed concerns about the cost of the new technologies,
and about the time they would need to invest in order to use them effectively
and efficiently. The need to be competitive with other planners was often
mentioned as a driving force and catalyst in the adoption of new technologies.
The most frequently expressed expectations from a multimedia GIS were improving
the planner's ability to:
-
maintain, manage and issue queries against data;
-
design convincing digital presentations;
-
analyse and manipulate data; and
-
produce simulations (e.g., of future landscape changes).
Finally, groups discussed the potential use of the Internet (chiefly the
WWW) to exchange and communicate spatial data, such as an LMP. Predictably,
those who already use the Internet professionally, or who were most likely
to use it in the future (e.g., government officials and some of the landscape
architects) were much more receptive to its potential use in landuse planning
than those with no Internet experience. Current Internet users felt that
it saved them time in their daily planning work, and that its use in exchanging
data with planning authorities could shorten the planning cycle.
Group members with little Internet experience - primarily the citizens
of Burggen and the landuse planners in Beuron - were sceptical about its
usefulness. They argued that the Internet is a future technology, and that
few people in the general population currently use it. They also felt that
it is complicated to use. Experienced Internet users criticised the poor
maintenance and documentation of much of the data available through the
Internet, pointing out that data could easily out-of-date, and that often
it is not clear who is responsible for what is published.
Conclusions
The computer is neither able to replace a field trip with a landscape architect,
nor reproduce the complexity of an individual's landscape perception in
a satisfying way. But we can use computer technology as a tool to raise
the public's awareness of the importance of nature and landscape protection,
as well as to involve people in the planning process itself. If this can
be accomplished, there is a much greater chance that the public will accept
and be willing to support the implementation of landuse planning proposals.
The digital presentation of multimedia-enriched landscape data combines
the realistic illustration of a landscape with the ability to obtain site-specific
data in an ad hoc, interactive manner. This is something which cannot easily
be done using conventional analogue maps and separate slide or video presentations.
Another advantage of digital presentations is their flexible handling of
scale through the 'zoom' feature of the GIS. Using this, one can easily
combine small and large scale maps of the same area. This can be useful
in, for example, helping a viewer better understand the importance of ecological
microstructures within the larger macrostructures of a landscape.
Working with a GIS means an additional investment of time and money
for self-employed landscape architects. A detailed record of the time we
spent preparing our digital presentation of the LMP was not kept. Although
our prototype presentation took several months to complete, this can be
expected to decrease considerably when digital presentations become routine
part of landuse planning.
Discussions with the test groups revealed that a digital presentation
- through elements such as sound, images, colour and interactivity - can
influence an audience more than can a conventional analogue presentation.
The use of background music, and the manipulation of images, sounds and
videos must therefore be looked at very critically.
Our study indicates that use of the Internet is not a viable alternative
for people who are unfamiliar with computers. In spite of the present popularity
of the Internet, regular use of the WWW in Germany is not yet widespread
among the general population. One of the reasons may be that there are
currently only a few Internet services (e.g., home banking) from which
the general population can benefit. However, the growing number of recently
installed Community Networks (Bürgernetze) in Bavaria (Werner &
Bayerische Staatsregierung 1997) indicates that interest in using the Internet
and the WWW (for purposes other than entertainment) is increasing. The
group discussions in this project have shown that people with little or
no Internet experience are leery of what appears to be a complicated and
strange technology. New techniques recently presented in Berlin in the
exposition Internationale Funkausstellung (Haas & Tunze 1997), which
integrate Internet and television technologies, have the potential to deliver
Internet services to people in a more "familiar" format. This may be an
important factor in the broadening the acceptance and usage of the Internet
and WWW.
Digital technologies make it easier for landuse planners to manipulate
data to suit their own ends. These technologies will play an important
role in landuse planning only if planners use them with a sense of responsibility.
The expense of preparing a digital LMP is justifiable providing the
digital data is not converted back to India-ink drawings in order to make
future revisions. The data must remain in its digital form for future processing,
dissemination and presentation.
Acknowledgements
We wish to thank Gordon Runtz in Vancouver and the anonymous revisers from
Forest & Landscape Research for the critical review of the article.
Literature
-
Bayerische Akademie für Naturschutz und Landschaftspflege (ed.) 1996:
GIS in Naturschutz und Landschaftspflege. Laufener Seminarbeiträge
4/96, Laufen, 88 pp.
-
Bayerisches Staatsministerium für Landesentwicklung und Umweltfragen
(ed.) 1996: Leitfaden zur Fortentwicklung des gemeindlichen Landschaftsplanes
als Teil des Flächennutzungsplans in Bayern: "Landschaftsplanung am
Runden Tisch", München, 34 pp.
-
Bill, R. 1996: Grundlagen der Geo-Informationssysteme: Vol. 2: Analysen,
Anwendungen und neue Entwicklungen.,Wichmann, Heidelberg.
-
Bill, R. & Fritsch, D. 1994: Grundlagen der Geo-Informationssysteme:
Vol. 1: Hardware, Software und Daten, 2. Issue, Wichmann, Heidelberg.
-
Burrough, P. A. 1986: Principles of Geographical Information Systems for
Land Resources Assessment. Reprint 1994, Clarendon Press, Oxford, 194pp.
-
Cámara, A. 1997: Interacting with Spatial Data: The Use of Multimedia
and Virtual Reality Tools. Publication for the conference: Geographic Information
Research at the Millenium: GISDATA Final Conference. Le Bischenberg, France,
1997. Web page: www.shef.ac.uk/uni/academic/D-H/gis/camara.html
-
Haas, K. & Tunze, W. 1997: Die neuen Bouquets kommen nicht vom Floristen.-
Der Stern 36/97: 85-88.
-
Haines-Young, R. et al. (eds.) 1993: Landscape ecology and GIS. Taylor
& Francis, London, 288pp.
-
Keppler Konsumforschung GmbH (ed.) 1997: Erlebnisqualität des Waldes:
Ansätze für eine Kategorienbildung zur Ästhetik des Waldes,
unpublished expertise. Chair for Landuse Planning and Nature Conservation,
Freising.
-
Kias, U. 1996: Pen-Computer-Einsatz und GIS in der landschaftsplanerischen
Bestandsaufnahme - dargestellt am Beispiel der Strukturen- und Nutzungskartierung
im Rahmen der Ländlichen Neuordnung in Bayern. Publication for the
4. German ArcInfo User Conference in Freising.
-
Kiemstedt, H. 1994: Landscape Planning: Contents and Procedures. Ministry
for Environment, Nature Protection and Nuclear Safety, Bonn, 34pp
-
Luz, F. 1995: Zur Akzeptanz landschaftsplanerischer Projekte. Determinanten
lokaler Akzeptanz und Umsetzbarkeit landschaftsplanerischer Projekte zur
Extensivierung, Biotopvernetzung und sonstiger Maßnahmen des Natur-
und Umweltschutzes, Verlag P. Lang, Frankfurt, Bern.
-
Raper, J. 1997a: Progress Towards Spatial Multimedia. - In: Craglia, M
& Couclelis, H (eds.): Geographic Information Research., Taylor and
Francis, London
-
Raper, J. 1997b: Geographic Information on the Web. Publication for the
conference: Geographic Information Research at the Millenium: GISDATA Final
Conference. Le Bischenberg, France, 1997. Web page: www.shef.ac.uk/uni/academic/D-H/gis/raper.html
-
Reis Machado & Ahern 1997 (eds.): Environmental Challenges in an Expanding
Urban World and the Role of Emerging Information Technologies. National
Centre for Geographical Information, Lisbon, Portugal, 521pp.
-
Schmidt-Belz, B. et. al. 1997: Validierung einer WWW-basierten Unterstützung
für die Stadt- und Raumplanung. - In: Dollinger, F. & Strobl,
J. (eds.): Salzburger Geographische Materialien Vol. 26: 391-396.
-
Shiffer, M. 1995: Interactive multimedia palling support: Moving from standalone
systems to the WWW. - In: Interactive GIS and Multimedia in Environmental
Planning: Planning and Design. Vol. 22
-
Strasser, D. & Wasserburger, W. 1997: Interaktive Publikationen von
GIS-Daten über das Internet. - In: Dollinger, F & Strobl, H. (eds.):
Salzburger Geographische Materialien Vol. 26: 417-420.
-
Warner, S.W. 1993: Considerations when measuring from a single photograph:
positional uncertainty of digital monoplotting. In. Norsk Geogr. Tidsskr.
Vol. 47: 39-50.
-
Weidenbach, M. (in preparation): Möglichkeiten und Grenzen Geographischer
Informationssysteme und neuer digitaler Medien in der Forst- und Landschaftsplanung.
Dissertation am Lehrstuhl für Landnutzungsplanung und Naturschutz,
Ludwig-Maximilians Universität, München.
-
Weidenbach, M. & Wild, P. 1997: Detailed Visual and Amenity Design
Guidelines for Forestry: Optimising Rural Resource Potential, Consolidated
Annual Progress Reports, Chair for Landuse Planning and Nature Conservation,
University Munich, not published, web page: www.lnn.forst.uni-muenchen.de/daten/foram.
-
Werner, A & Bayerische Staatsregierung (eds.) 1997: Den Bürgern
einen tatsächlichen Nutzen bringen: Ein Gespräch mit Staatsminister
Bocklet - BayernOnline. 2/97:1-5
List of Tables and Figures
Table 1. Date, location, audience and content of presentation
Fig. 1. GIS-based presentation of the Landscape Master Plan
to the community council of the small Bavarian village, Burggen, using
a laptop computer and overhead projector.
Fig. 2. Videos with sound illustrate the conflicts with respect
to recreation
Fig. 3. Photoshop simulation of growth of afforestations
helps to illustrate future conflicts
Fig. 4. Three-dimensional landscape analysis with line of sight
calculations (lower right) and a Virtual Reality Landscape Model (upper
left).
Go to FORAM